






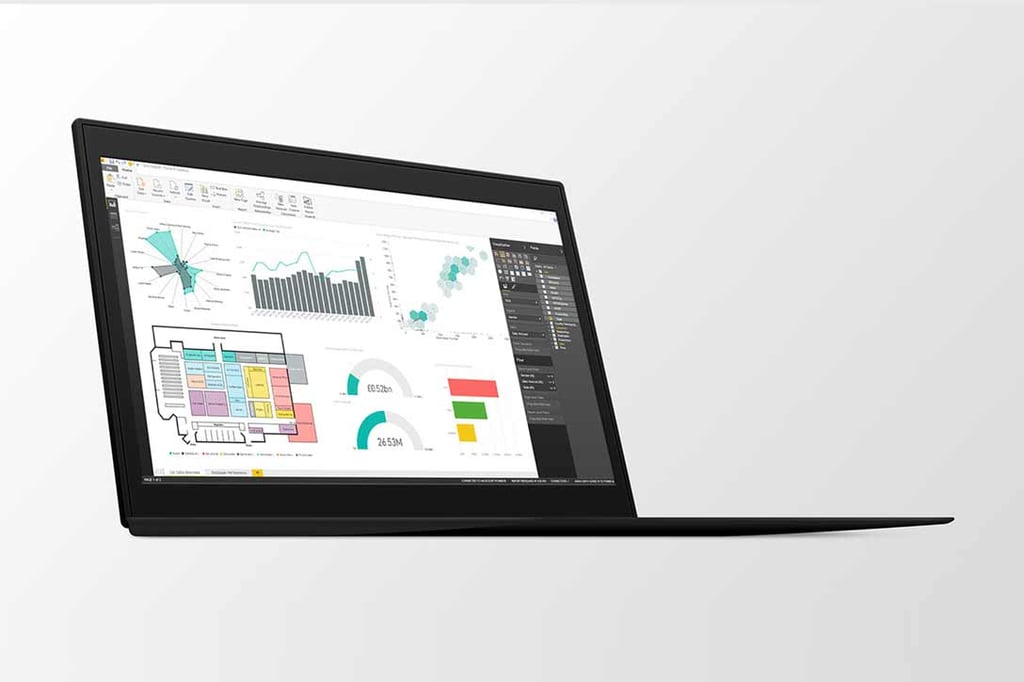

The September update for Power BI Desktop brings a new “drillthrough” capability, one of several features Microsoft demonstrated during its Data Insights Summit in June.
Power BI Desktop users can now add another layer of interactivity to their reports with new drillthrough filters, according to Amanda Cofsky, a Microsoft Power BI program manager. “Drillthrough filters allow you to create a page in your report that provides details on a single ‘entity’ in your model, such as a customer, manufacturer, product, or location,” she wrote in a blog post.
Based on the entity selected by a user, the new drillthrough page displays charts and other visualizations in context, allowing them to glean new insights by surfacing additional levels of detail. For example, if a report shows slow sales of a particular product, users can investigate further by right-clicking on the product’s manufacturer for more information on the company, its other products, satisfaction ratings and other metrics.
To help ensure that users don’t get lost, the software automatically includes a back button when it creates drillthrough pages. Report authors can turn off the feature by flipping the back button toggle switch in Power BI desktop.
A walk-through of the new drillthrough pages feature and an accompanying video are available in Cofsky’s blog.
Users also have a new visualization to pick from this month, the ribbon chart. Suitable for displaying changes in rank, the visual is similar to “a stacked column chart, but each column’s inner categories are sorted according to their rank for that column,” explained Cofsky. “Additionally, the inner categories are connected by ribbons across the columns to help you visually see how the rank changes across the columns.”
The sampling algorithm used in scatter charts has been updated, offering improved performance in charts containing many data points. Additional color and style controls allow report authors to customize the gridlines used in their charts.
Also new is an interactive reporting capability that uses machine learning to explain to users why a data point within a chart increased or decreased in value compared to the previous data point. Power BI delivers its insights as a pop-up using a plain-English explanation along with supporting charts.
An included chart switcher allows users to change the type of supporting chart (waterfall, scatter, stacked column or ribbon chart) displayed in the pop-up for different perspectives on an insight. The feature is available now in preview, in both editing and reading modes, said Cofsky.
An update to the software’s new theme features, also in preview, allows users to control the style of charts. This comes in handy when organizations may have selected a standard look and feel for their reports, but Power BI’s defaults don’t reflect those preferences. September’s theme update allows users and organizations to customize the visual style of their charts and set the standard formatting tools to their liking.
For the visually impaired, Microsoft has added an accessible chart data view that allows users to explore a data table using a screen reader. Users can access the feature with a keyboard shortcut (Alt+Shift+F11), said Cofsky.