




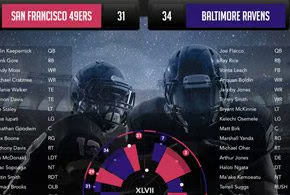
Infragistics, a maker of developer controls and design tools to help developers build more appealing applications, announced its creation of a new application called SBViz, a new type of chart that visualizes NFL football games—just in time for the Super Bowl XLVIII on Feb. 2.
Although the new visualization is targeted at the “Big Game,” the chart has a clear translation to business applications as well, Dave Mendlen, chief marketing officer at Infragistics, told eWEEK.
The idea for SBViz arose when two Infragistics team members sought out to re-look at Super Bowl data in a new way. They wanted to be able to look at each game in a visualization that would tell them at a glance what happened. In the course of a week, this new chart and application was born.
It all started when Tommy Rausch, leader of the creative team at Infragistics, turned his attentions away from a football game he was watching at a party and began to think about how he could visualize a game in some type of chart fashion that could tell the entire story of the contest. Rausch said it was halftime during a Sunday NFL game at a kids’ football team party and the closest thing at his disposal was an empty pizza box, so he grabbed it and started sketching out the concepts for SBViz.
“Each game is split into four quarters, and within each quarter, the ball is moved forward by a team,” he said. “We looked at that idea and came up with a chart that shows how long each team had possession, what happened at the end of that possession and we quickly found this brand-new way of seeing a game.”
The next day at work, Rausch decided to show the concept to his team and quickly impressed on them that not only could it work for visualizing the ups and downs of football games, but also the flows of business cycles and sales and the like.
Rausch enlisted Stephen Zaharuk, a lead developer at Infragistics, who built the chart and the application. “I was amazed how quickly we were able to turn Tommy’s prototypes into a real application,” he said. “I built it initially in our iOS controls. We have a tool that converts our controls across computing platforms, so we’re going to have this new chart control available across all of our platforms, including Windows Forms, HTML5, jQuery, MVC, ASP.NET and WPF.”
Rausch, who has worked in a variety of jobs and settings in the creative arena, said he previously worked with NFL Hall of Famer Joe Montana on a project. He said he showed the mock-up of SBViz to Montana and Joe gave it a thumbs-up and asked for a copy of the app when it was complete.
Meanwhile, when the team showed the app to Mendlen, he was immediately interested as a football fan, but as a marketing executive, he also saw the value of it for business. “In the same way that executives find it difficult today to see how their business is performing, it’s equally hard to visualize what happened in a football game. It’s the macro picture that’s not yet easily visualized,” explained Mendlen.
The applicability of this visualization to business scenarios is very clear. As in football, most companies operate on quarters—fiscal quarters. And most companies are monitoring progress, but instead of watching a football, they want to visualize the progress of a product or salesperson, Mendlen said. And with this new visualization, it’s as easy to see the performance of Marshawn Lynch as it is to see the growth in sales in 2014.
For businesses that want to visualize data in new and unique ways, Infragistics will be providing this patent-pending control in upcoming versions of Infragistics Ultimate—for Web developers with HTML 5, iOS developers with native controls, and ASP.NET, Windows Forms and WPF developers.
The iPad and iPhone versions of SBViz are available on the Apple App Store, and a video of the app and more details can be found at www.sbviz.com.