




- eWEEK Labs Walk-Through: AirMagnet Survey 3.0 Pro
- eWEEK Labs Walk-Through: AirMagnet Survey 3.0 Pro – Calibrate
- eWEEK Labs Walk-Through: AirMagnet Survey 3.0 Pro – Walkabout
- eWEEK Labs Walk-Through: AirMagnet Survey 3.0 Pro – Access point 1
- eWEEK Labs Walk-Through: AirMagnet Survey 3.0 Pro – Combined access points
- eWEEK Labs Walk-Through: AirMagnet Survey 3.0 Pro – Unfiltered display
- eWEEK Labs Walk-Through: AirMagnet Survey 3.0 Pro – Active survey
- eWEEK Labs Walk-Through: AirMagnet Survey 3.0 Pro – Packet loss
- eWEEK Labs Walk-Through: AirMagnet Survey 3.0 Pro – Link rate
- eWEEK Labs Walk-Through: AirMagnet Survey 3.0 Pro – Spectrum
- eWEEK Labs Walk-Through: AirMagnet Survey 3.0 Pro – Multiple floors
- eWEEK Labs Walk-Through: AirMagnet Survey 3.0 Pro – Simulation
eWEEK Labs Walk-Through: AirMagnet Survey 3.0 Pro
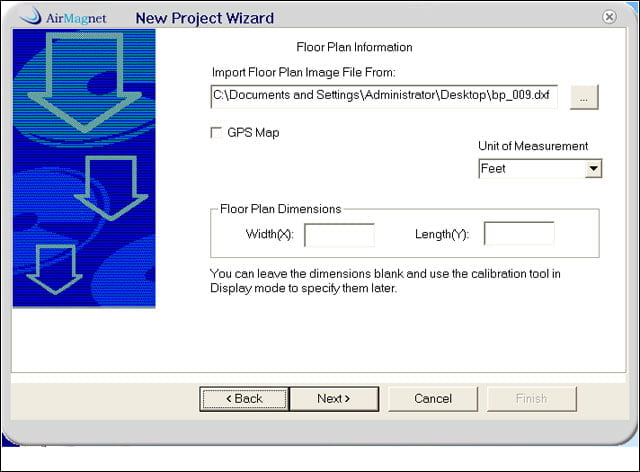
During testing of AirMagnets AirMagnet Survey 3.0 Pro, we imported a CAD drawing for our blueprint, but just about any file format works. If we knew the building dimensions, we could enter them here.
eWEEK Labs Walk-Through: AirMagnet Survey 3.0 Pro – Calibrate
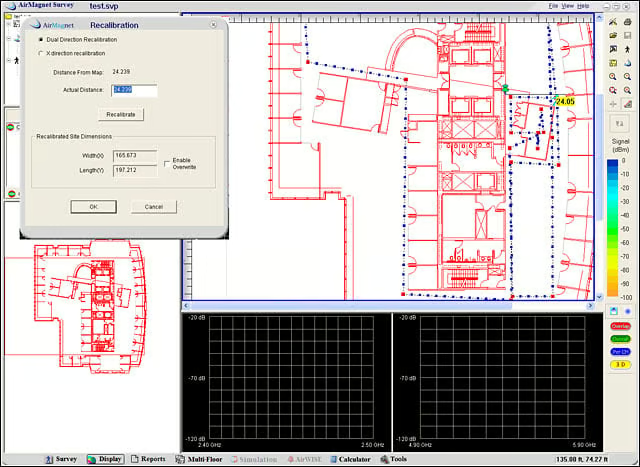
To calibrate the map, we measured the physical distance between two points, then found the spot on the map and input the distance. AirMagnet Survey extrapolates the rest.
eWEEK Labs Walk-Through: AirMagnet Survey 3.0 Pro – Walkabout
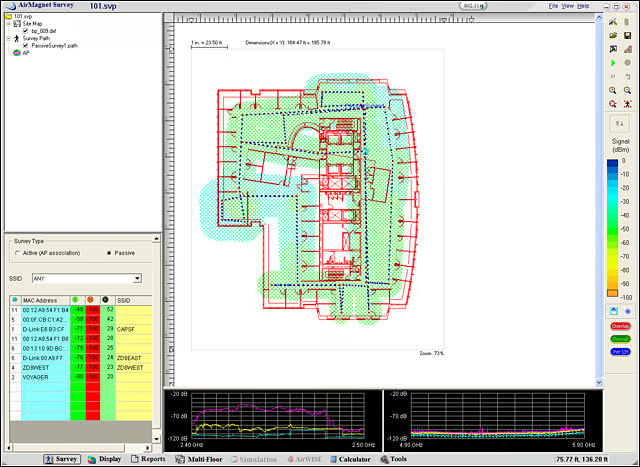
This displays the route we walked during our passive survey. We needed to click on the map periodically to indicate our location, to provide a frame of reference for the algorithms to do their thing.
eWEEK Labs Walk-Through: AirMagnet Survey 3.0 Pro – Access point 1
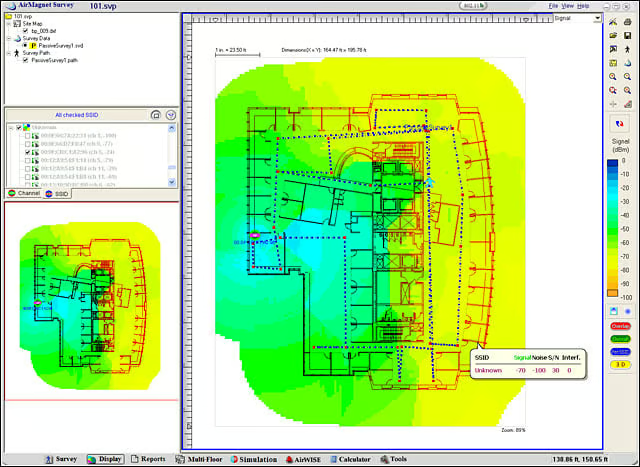
This shows the heat map for one access point, highlighting where signal is strong (blue) or weakened (yellow).
eWEEK Labs Walk-Through: AirMagnet Survey 3.0 Pro – Combined access points
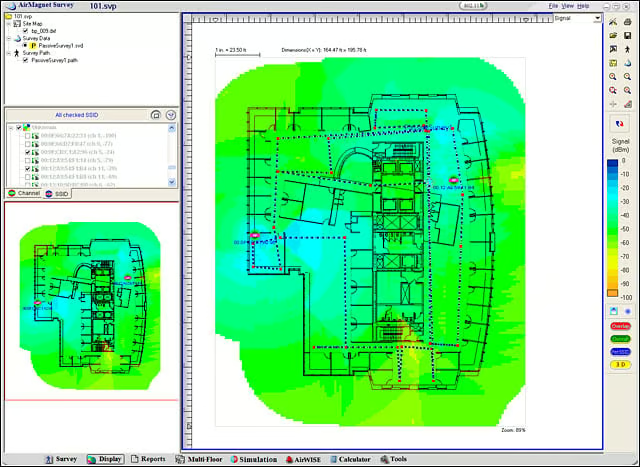
The combined coverage our two access points.
eWEEK Labs Walk-Through: AirMagnet Survey 3.0 Pro – Unfiltered display
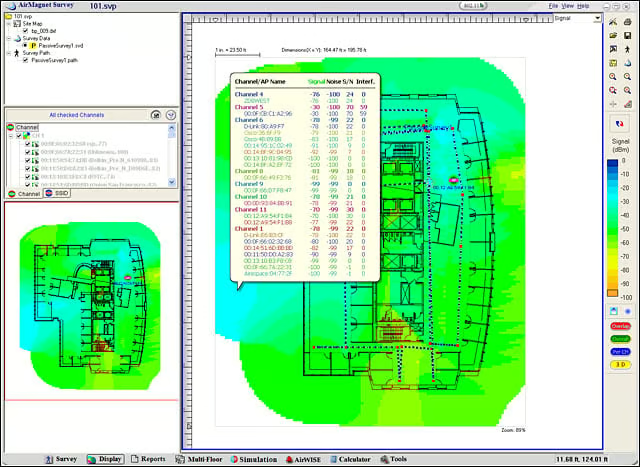
At any given spot on the map, AirMagnet Survey will list the aggregate APs detected at that location.
eWEEK Labs Walk-Through: AirMagnet Survey 3.0 Pro – Active survey
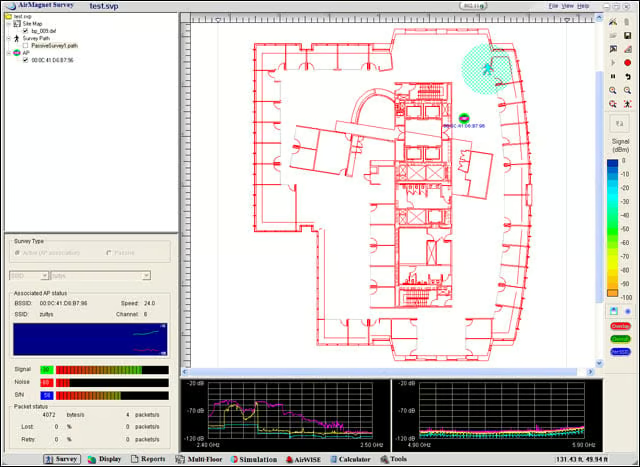
The active survey shows different information in real time, including link rate, retries and lost packets.
eWEEK Labs Walk-Through: AirMagnet Survey 3.0 Pro – Packet loss
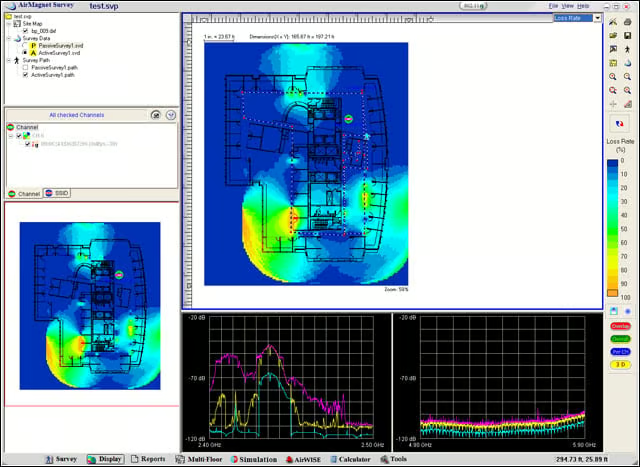
The areas of our network where we encountered the greatest packet loss are shown in yellow.
eWEEK Labs Walk-Through: AirMagnet Survey 3.0 Pro – Link rate
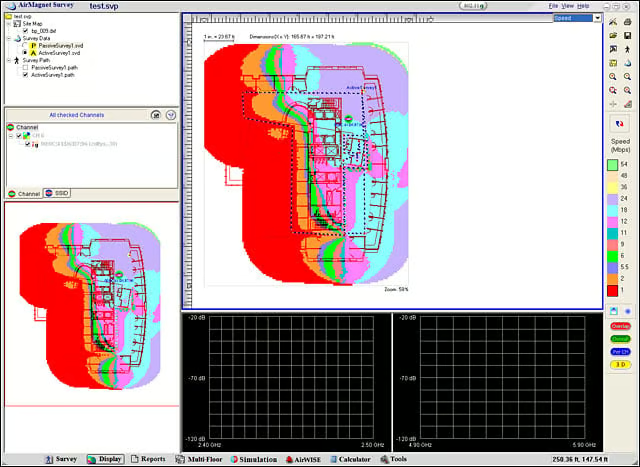
This map predicts where link rates will drop when associated to one particular, poorly placed access point.
eWEEK Labs Walk-Through: AirMagnet Survey 3.0 Pro – Spectrum
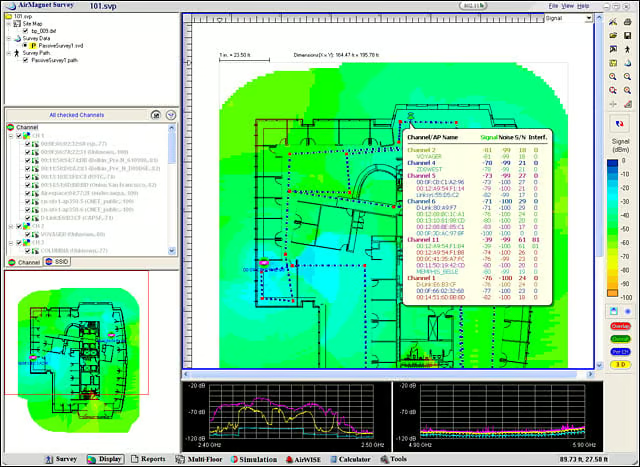
To look at the spectrum interference for a specific location along the path we had walked, we clicked on the location to get the corresponding information for the 2.4GHz (bottom left) and 5GHz (bottom right) bands.
eWEEK Labs Walk-Through: AirMagnet Survey 3.0 Pro – Multiple floors
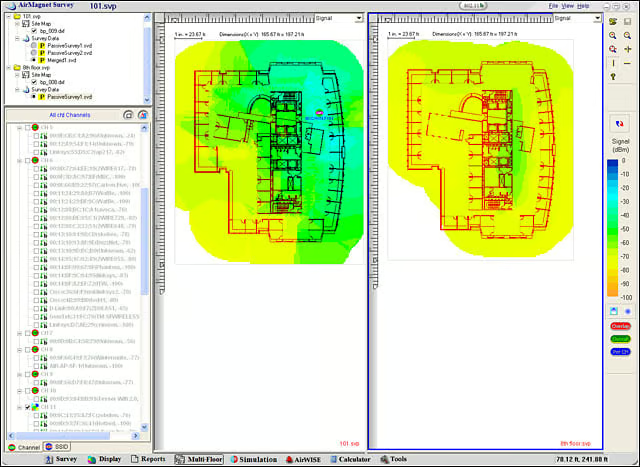
We could do side-by-side analysis of one access points characteristics as seen from multiple floors.
eWEEK Labs Walk-Through: AirMagnet Survey 3.0 Pro – Simulation
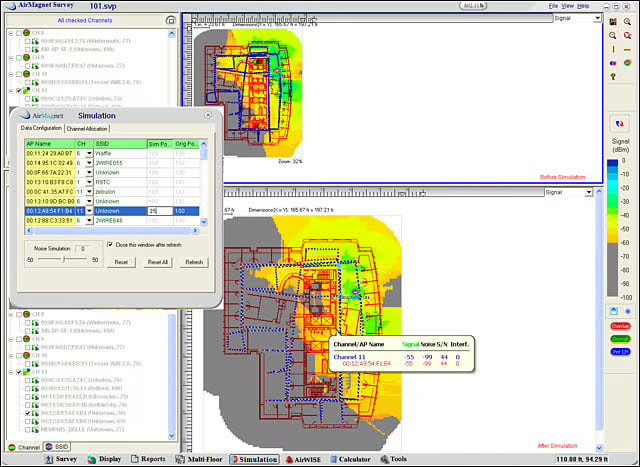
We could simulate what a network would look like if we reduced the APs transmit power from 100 mW (above) to 25 mW (below).