


Seven Reasons Why Zend Z-Ray Is Winning Favor With PHP Developers

by Darryl K. Taft
Page Requests
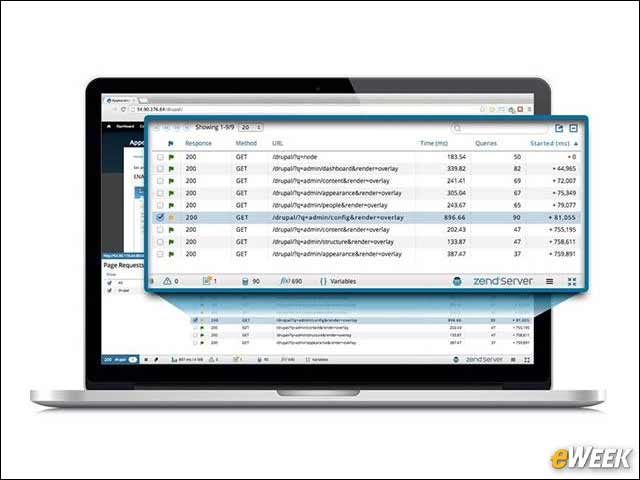
You can inspect the requests sent from your page to the Web server, and view their response, method, path and the time they took. You also get an indication of issues that may have occurred during their execution. When there are multiple requests as in the case of AJAX or equivalent, Z-Ray can filter the information to show only the results from any subset of these requests.
Execution Time
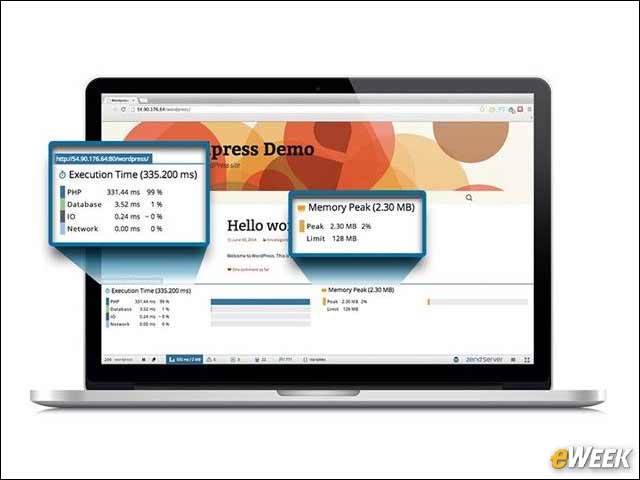
Users can view the Execution Time panel to see a processing breakdown of the request, so you can understand how the request was handled by the Web server. Also, you can see the peak amount of memory that was consumed by the request.
Monitor Events
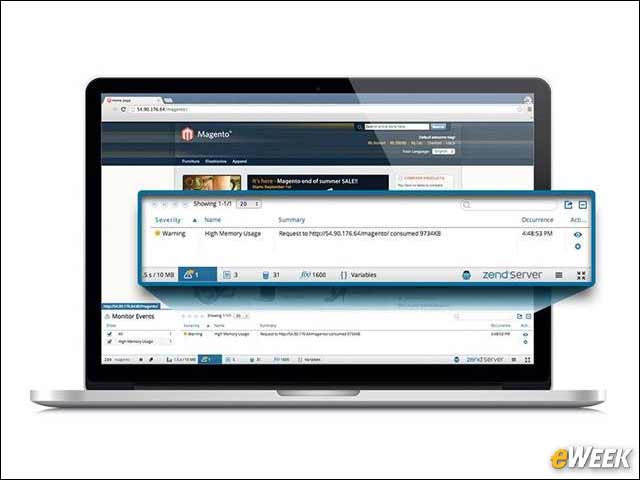
You can view a list of the Zend Server events that may have been triggered by the request, alerting you about PHP errors, high memory usage, slow request execution and more. From this panel, you can find additional details about these events in the Zend Server UI, or access a code trace, if one was triggered by the event.
Errors and Warnings
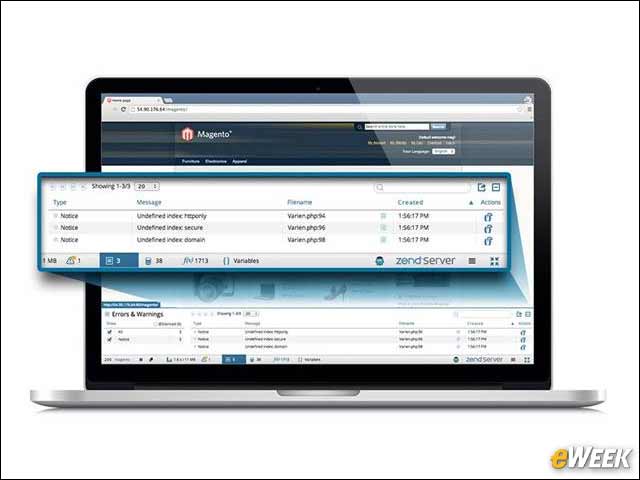
The Errors and Warnings panel displays the errors generated during the page request by PHP itself or by its core functions. Z-Ray tells you when they were created, their type and the associated error messages.
Database Queries
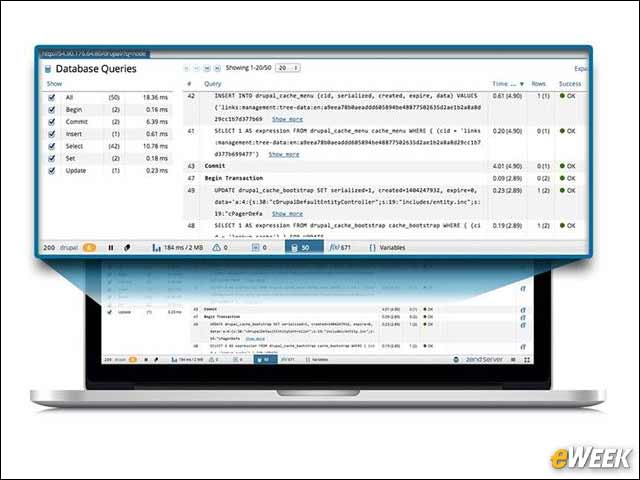
The Database Queries panel displays all the SQL queries executed by the page request. It shows priceless information such as the query’s bound value, the result of the query, how long the query took and the number of rows in the code affected by the query. You can even see a backtrace of the query to get the larger picture of how the code was executed.
Functions
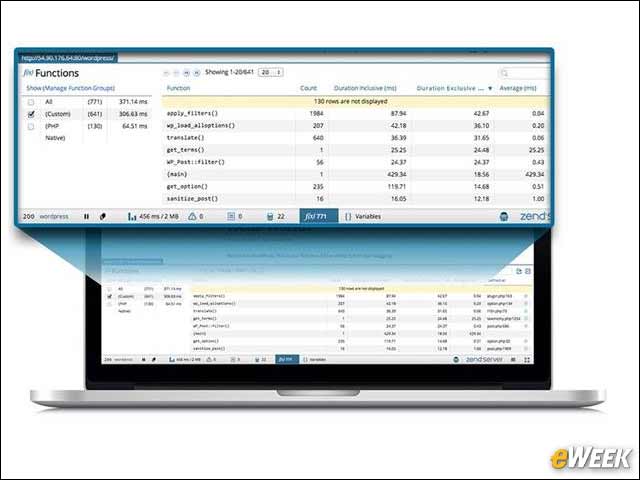
In the Functions panel you’ll be able to see all the PHP functions called during the page request. You can see the name; how many times called; time spent in the scope of the function, including or excluding time spent in children functions; and more. If you use any of the PHP frameworks, you can filter by function groups and name spaces.
PHP Variables
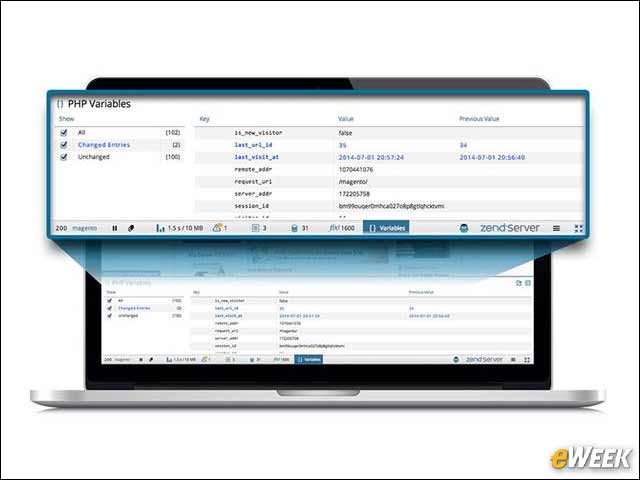
You can use the Variables panel to see any PHP “superglobals” used in your code. You can see, for example, if the value of your session or cookie superglobals changed between the start and completion of the request, and what the change was. PHP superglobals are arrays that give a PHP script global access to data originating externally. PHP superglobals represent data coming from URLs, HTML forms, cookies, sessions and the Web server itself.