


- Apple iWork 08 Ably Fills Spreadsheet Hole with Numbers
- Apple iWork 08 Ably Fills Spreadsheet Hole with Numbers – Charting Tables
- Apple iWork 08 Ably Fills Spreadsheet Hole with Numbers – Exporting Files
- Apple iWork 08 Ably Fills Spreadsheet Hole with Numbers – Font Issues
- Apple iWork 08 Ably Fills Spreadsheet Hole with Numbers – Looks Like Excel
- Apple iWork 08 Ably Fills Spreadsheet Hole with Numbers – Tables Turned
- Apple iWork 08 Ably Fills Spreadsheet Hole with Numbers – See More Slideshows Like This One
Apple iWork 08 Ably Fills Spreadsheet Hole with Numbers

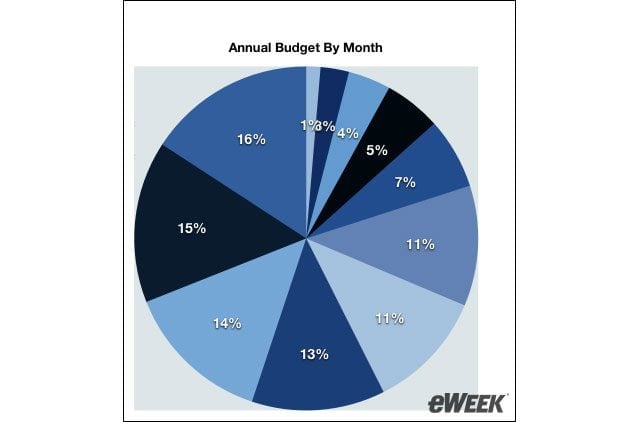
Users can create charts to organize information contained within a table.
Apple iWork 08 Ably Fills Spreadsheet Hole with Numbers – Charting Tables
To create a chart using information contained within a spreadsheet’s tables, users select the table they wish to chart and then simply select which type of chart they’d like to use to organize the information.
Apple iWork 08 Ably Fills Spreadsheet Hole with Numbers – Exporting Files
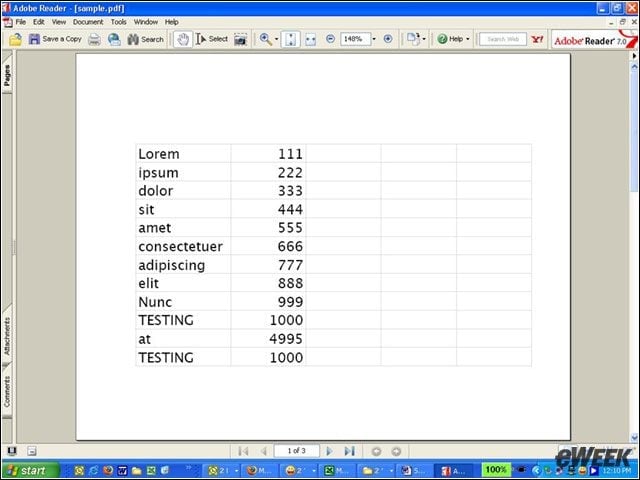
In iWork ’08, Numbers can export files to PDF or Excel formats. Here, a Numbers spreadsheet is exported to PDF.
Apple iWork 08 Ably Fills Spreadsheet Hole with Numbers – Font Issues
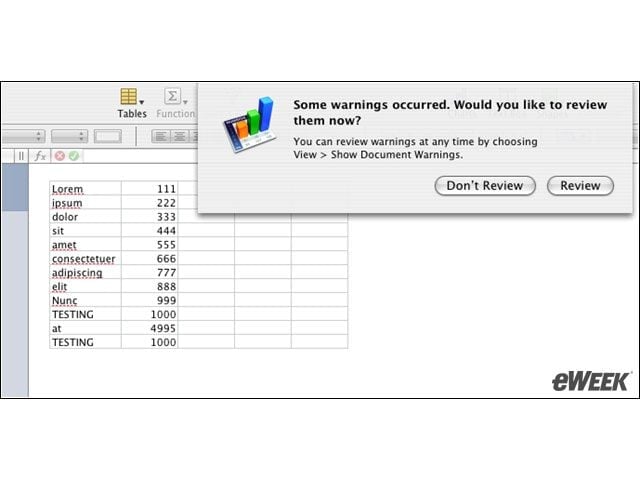
One of the drawbacks of importing spreadsheets in Numbers is the program’s inability to support all Microsoft-supported fonts.
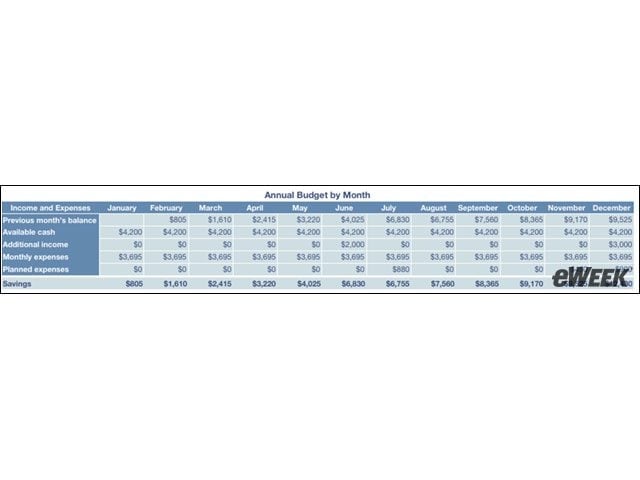
Apple iWork 08 Ably Fills Spreadsheet Hole with Numbers – Looks Like Excel
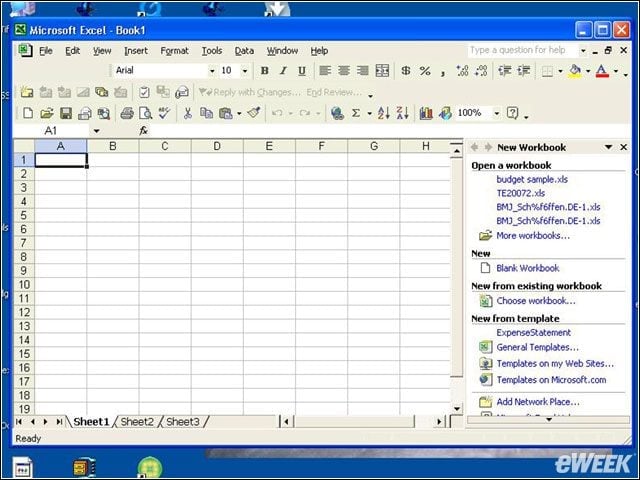
Users accustomed to Excel will find the look and feel of Numbers a near match.
Advertisement
Apple iWork 08 Ably Fills Spreadsheet Hole with Numbers – Tables Turned
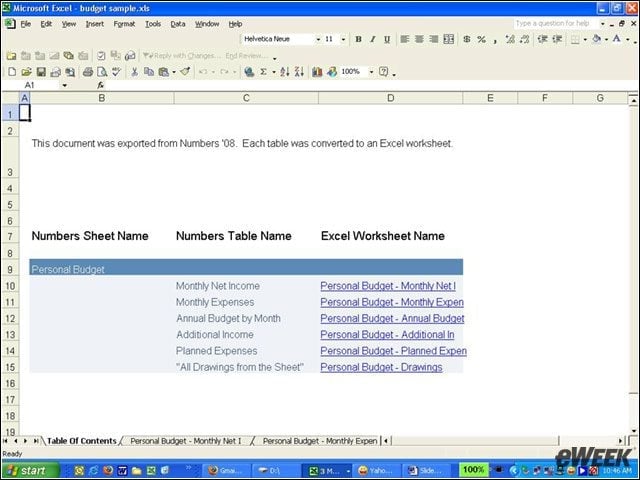
Tables that appear on one spreadsheet in Numbers are dispersed over three spreadsheets in Excel.
Apple iWork 08 Ably Fills Spreadsheet Hole with Numbers – See More Slideshows Like This One

- Channel Products of the Year
- Two Windows