


- PRTG Network Monitor Unifies Management Tools on Single Platform
- Powerful Auto Discovery Tools Save Time
- Inventory Tools Simplify Network Device Management
- Charts Show Attached Devices Over Variable Periods
- Collected Data Stored for Long-Term Baseline Analysis
- Comprehensive Settings for Device Logins
- PRTG Clearly Reports Alarms
- There Are Logs Galore
- Interactive Dashboards Are Highly Customizable
- Create Network Maps Based on Various Criteria
- Tracking Sensor Performance
- Filtering Sensor Warnings
- View Customizable Reports in PDF or HTML Formats
- GeoMapping Visualizes Device Locations
- Warning Logs Help Troubleshoot Sensors
- Multiple Options for Device Drill-Down
PRTG Network Monitor Unifies Management Tools on Single Platform
PRTG Network Monitor wants to help IT managers trust their network monitoring tools. Here’s a rundown of the features included in the latest version.
Powerful Auto Discovery Tools Save Time
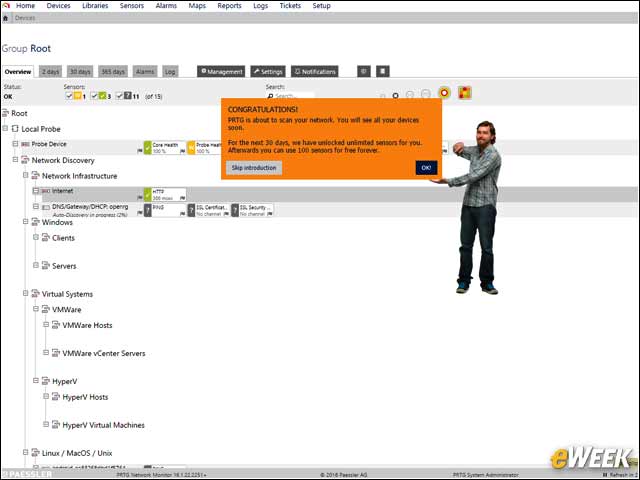
PRTG offers a comprehensive suite of automated discovery tools that can query the network based on numerous criteria. That means connected devices are discovered readily and subsequently prepared for sensor deployment and inventory. Discovery eliminates much of manual processes associated with adding devices to a network management platform and reduces the time it takes to start using the platform effectively.
Inventory Tools Simplify Network Device Management
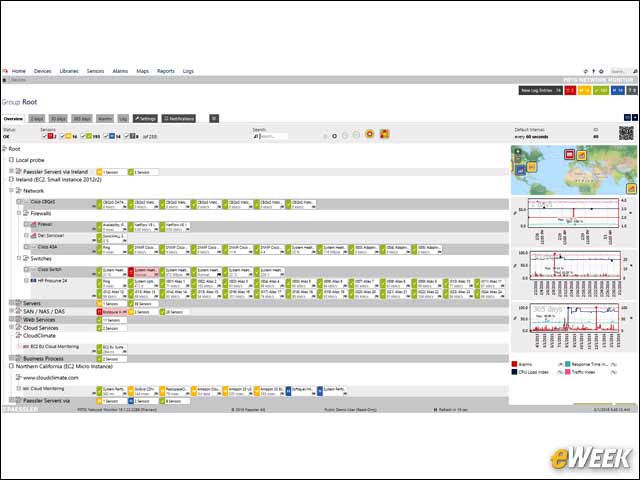
Discovered devices can be inventoried into easy-to-manage groups. Administrators can filter those groups based on multiple criteria, ranging from location to vendor to function and more. That flexibility makes it easier to manage a given subset of network-attached devices and helps when it comes to measuring loads, planning upgrades or even performing forensic security tasks.
Charts Show Attached Devices Over Variable Periods
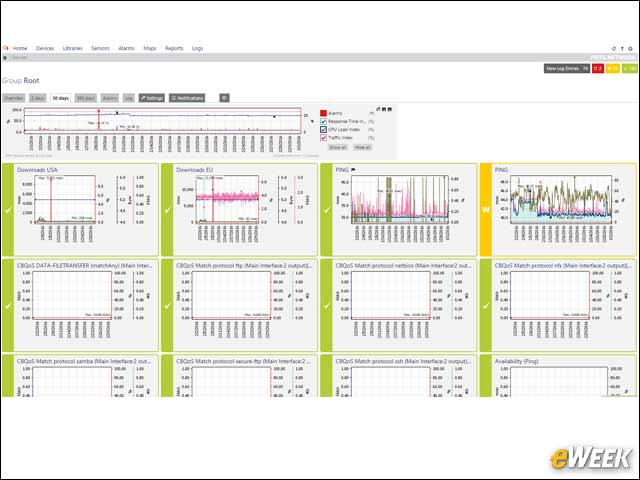
PRTG gathers extensive amounts of data on attached devices, which can then be rolled up into visualizations. The chart shown here presents a 30-day view of activity, which supports drill-down and other adjustments to fine-tune what devices are on view. In addition, color-coding and clearly identified peaks and valleys make it easy to spot outliers.
Collected Data Stored for Long-Term Baseline Analysis
Collected network data is stored for long-term analysis. This enables administrators to look at what has occurred over the last 365 days, which proves useful in identifying seasonal loads as well as unexpected traffic spikes. Criteria can be filtered based on numerous elements, ranging from CPU utilization to traffic loads to pretty much anything an administrator can think of.
Comprehensive Settings for Device Logins
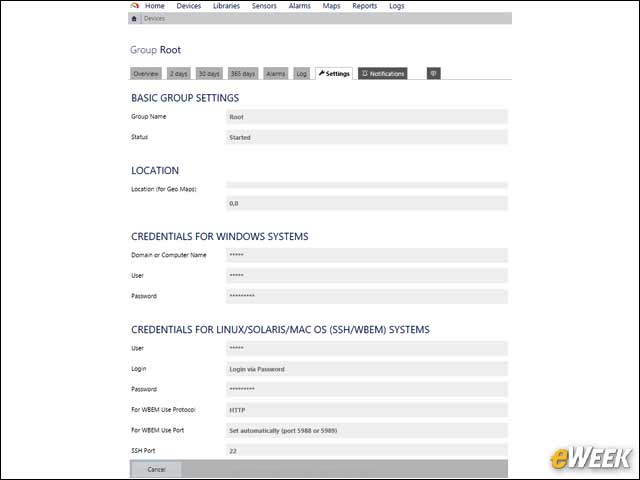
PRTG offers numerous setting screens to automate information-gathering by caching credentials required to log into network devices, servers and so forth. That cached information is protected from prying eyes, yet gives PRTG the ability to delve deeper into connected devices, automatically.
PRTG Clearly Reports Alarms
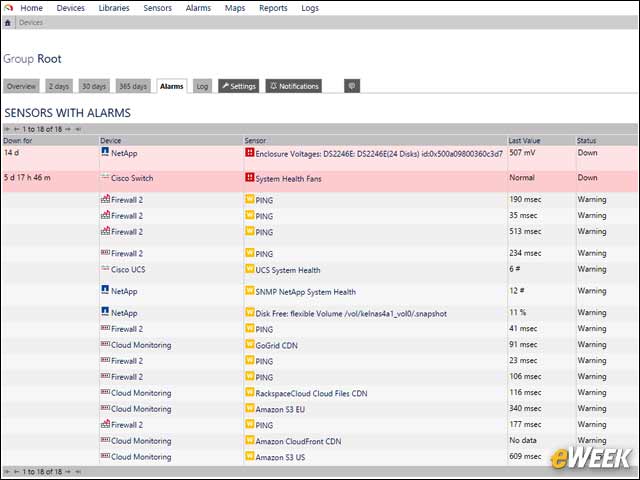
One of the most important elements of any network-monitoring tool is the ability to detect and display problems. PRTG offers several avenues to inform administrators of problems. The Sensors with Alarms screen offers insight into detected problems and gives advice on how to handle those problems while providing the ability to drill down into support and troubleshooting issues.
There Are Logs Galore
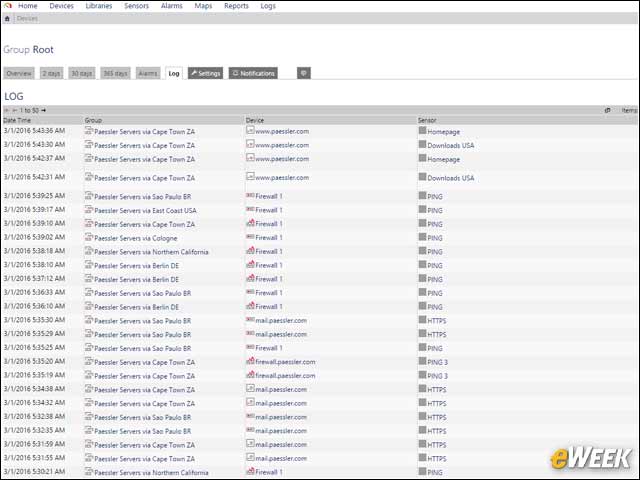
PRTG retains all logged information and can present it in myriad ways. Log entries provide details on numerous elements associated with a given device, and PRTG allows administrators to drill down into that logged data—an important capability for troubleshooting and security forensics.
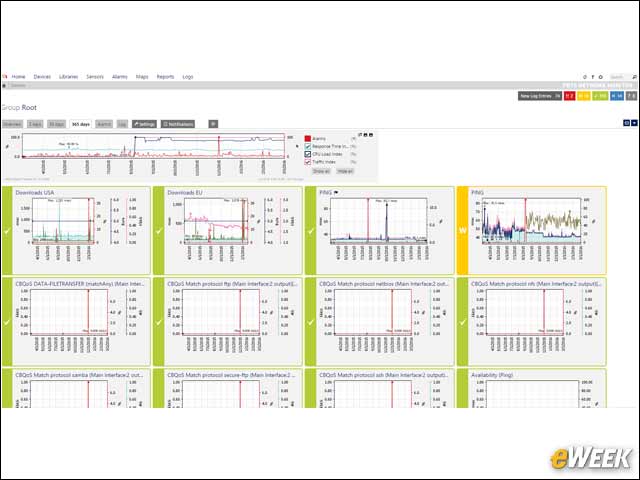
Interactive Dashboards Are Highly Customizable
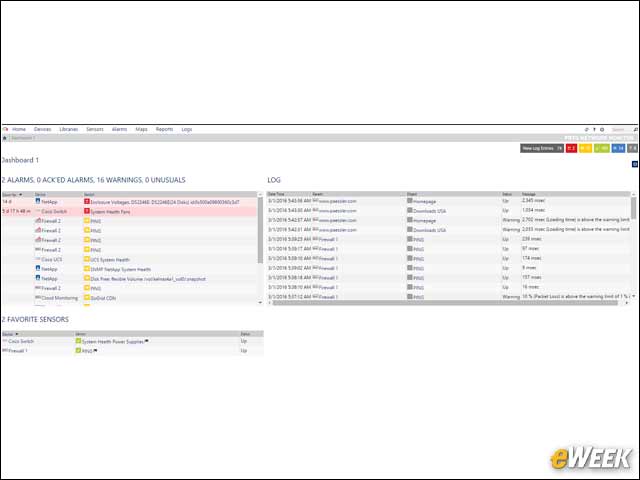
PRTG sports numerous customizable dashboards that administrators can define for a given set of circumstances. Dashboards support drill-down capabilities and the ability to launch additional dashboards. Dashboards can be built to display almost any data PRTG has gathered and can support frequent updates to present data almost in real time.
Create Network Maps Based on Various Criteria
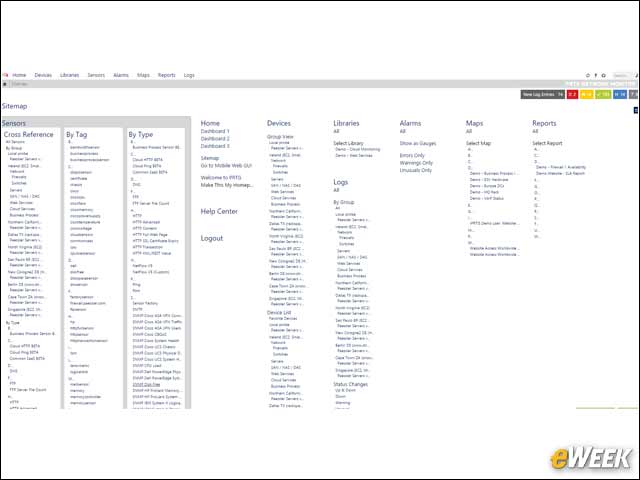
Network maps are a critical element of effective network management. PRTG offers several different takes on network mapping, allowing administrators to create conceptual maps as well as maps based on geographic locations. Maps can be transformed into filtered, information-delivery graphics that highlight particular elements of the network.
Tracking Sensor Performance
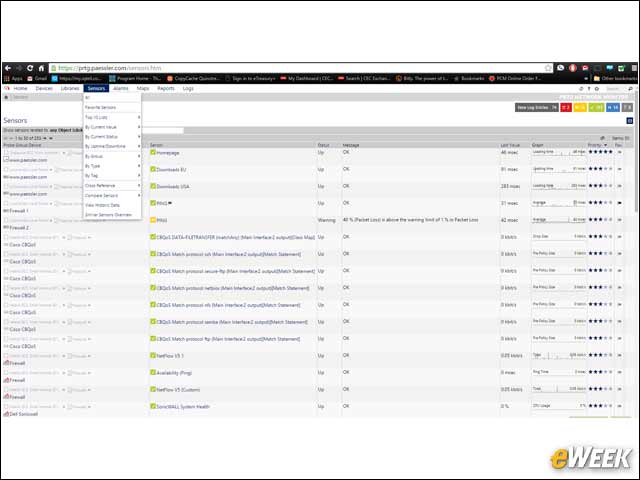
Sensors are a critical component of PRTG. The technology offers several ways to report, monitor and diagnose sensor performance, giving administrators insights into how effectively a sensor is working and the types of data being gathered. Administrators also can determine whether sensors are encountering any type of communications problems and then take action to solve those issues.
Filtering Sensor Warnings
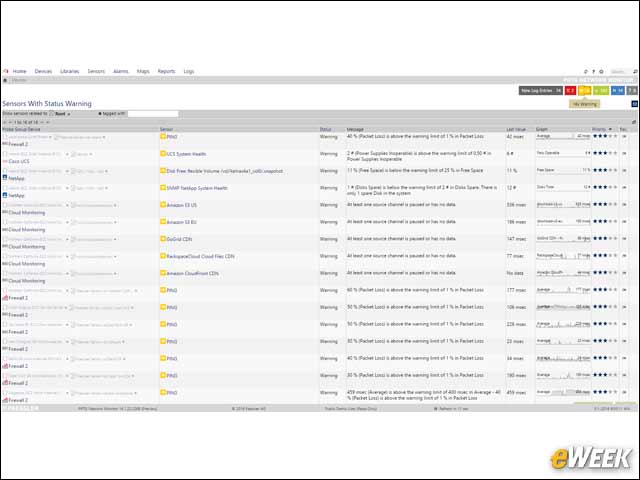
Network managers can filter sensor lists on their operational status, making it a simple mouse-click to display what sensors have a warning status.
View Customizable Reports in PDF or HTML Formats
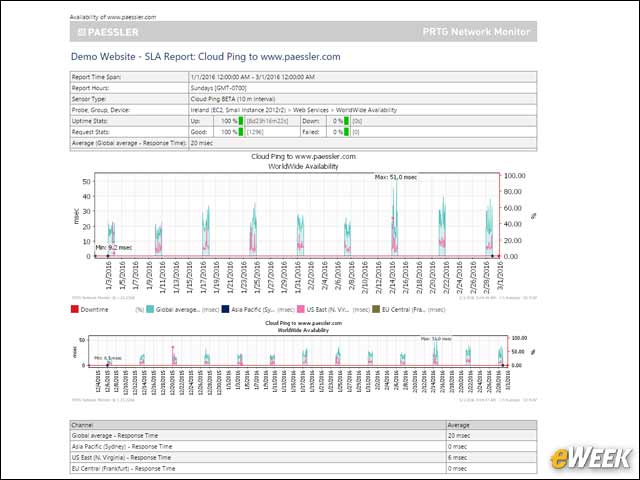
PRTG is able to report on a number of different data, and those reports are fully customizable. Here, report data can be normalized and based on a certain time frame to identify outliers in particular situations. Reports can be exported to PDF or HTML, or can be viewed directly on the management console.
GeoMapping Visualizes Device Locations
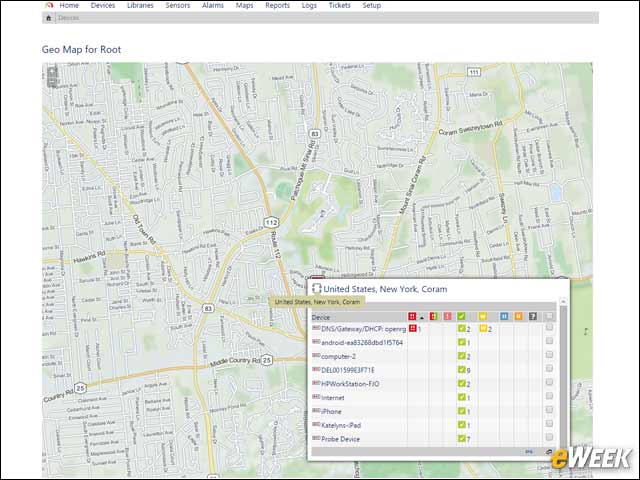
Just as placing a name with a face eases communications, so does placing a device with a location. PRTG offers the ability to create geographical maps that can display what network devices are located where, giving a navigable representation of when, where and how to deal with network issues.
Warning Logs Help Troubleshoot Sensors
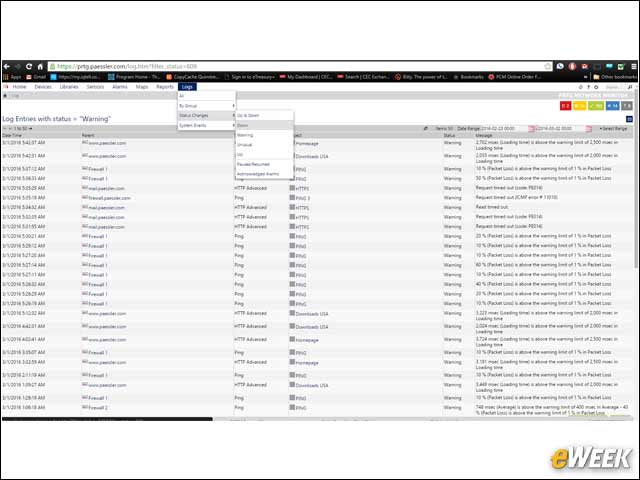
Just as with sensor warnings, PRTG users can report on warnings collected in the data logs. This can be useful when troubleshooting a device beyond what sensor data can offer. For example, logs may record unauthorized access attempts, indicating an attempted network breach. Or the logs can show if firmware updates occurred, suggesting it was a possible cyber-attack target.
Multiple Options for Device Drill-Down
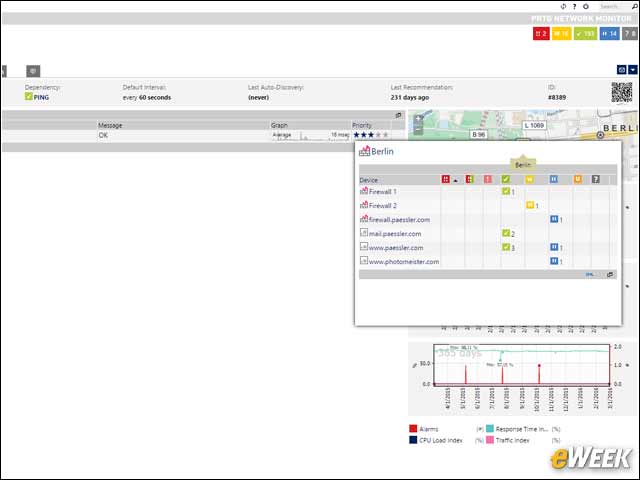
Throughout the technology, administrators have the ability to drill down into specific information. That capability is not lost when dealing with physical devices. Administrators can drill down from network maps, reports and so forth. The idea is to make it easy to investigate a problem, no matter from which dashboard, screen or report an administrator is starting.