


Labs Gallery: RoamBi Uses iPhone to Turn Dull Data into Eye Candy

Views
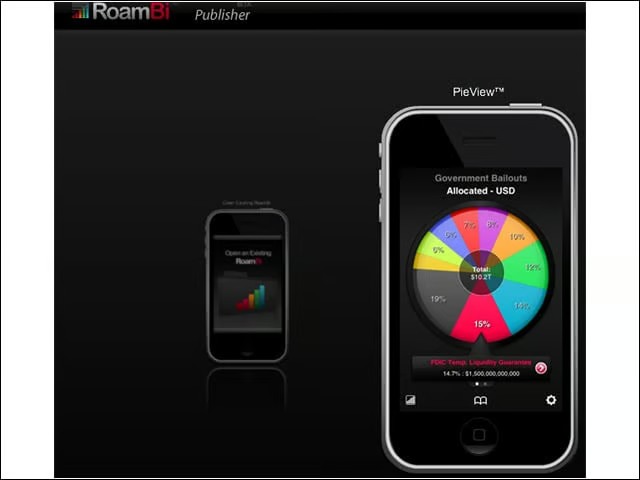
Using the RoamBi Publisher, I selected the pie chart view to present data to iPhone users. Other views include a card index, a list and Catalist, a list view with mini charts.
Data Import
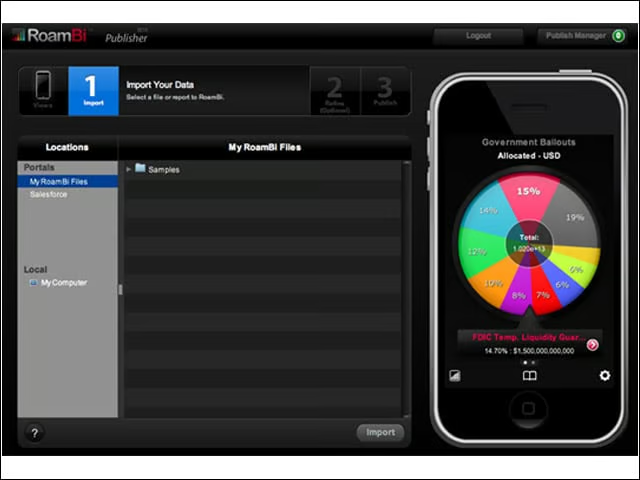
Data can be imported from a number of business intelligence sources. I pulled in statistical data on page hits at eWEEK.com.
Import 2
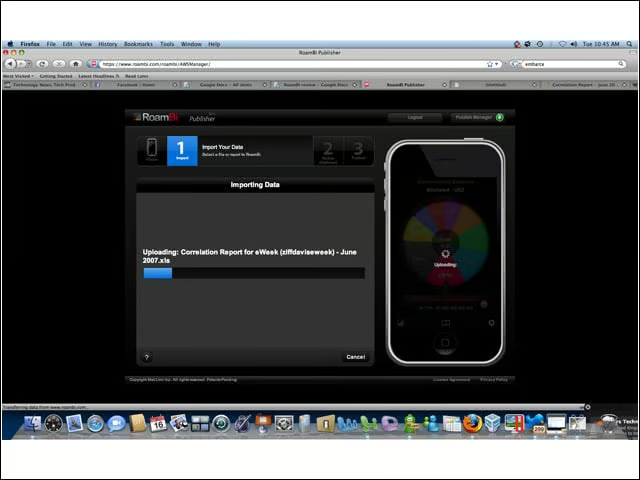
Here you can see the data import process in action.
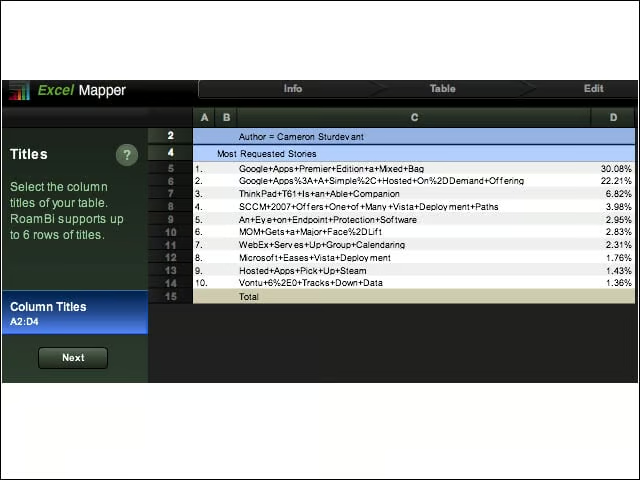
Chart Creation
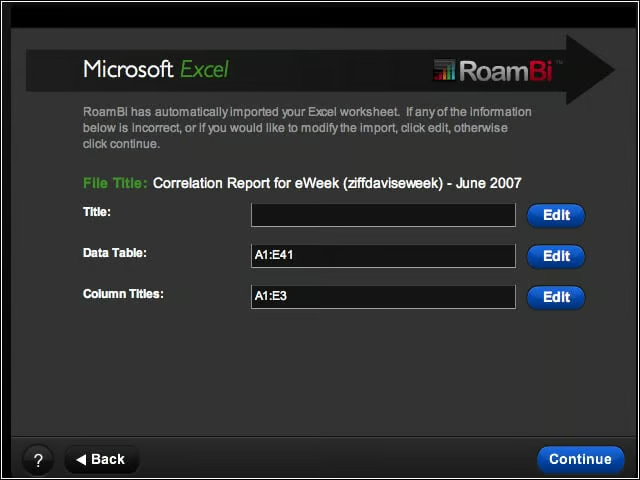
The RoamBi Publisher does a good job of guessing what data and headers should be used to present the data. I was able to fine-tune the selections to make my reports more usable.
Headers and Subtitles
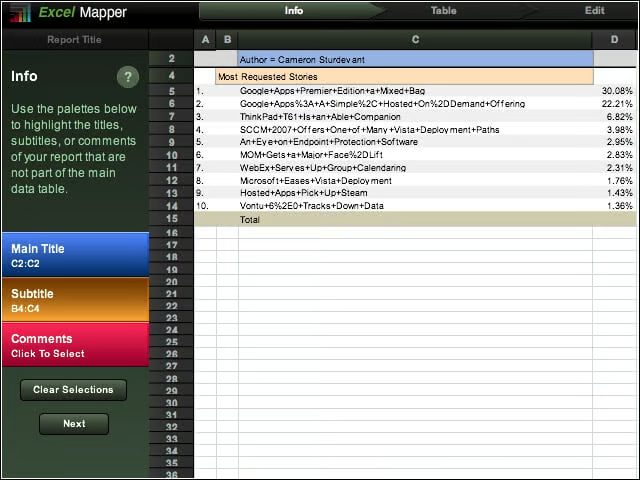
If you look carefully at the right side of the screen, you can see the blue and goldenrod highlights on the elements that will be used to create the main title and subtitles in the report.
Selecting Data
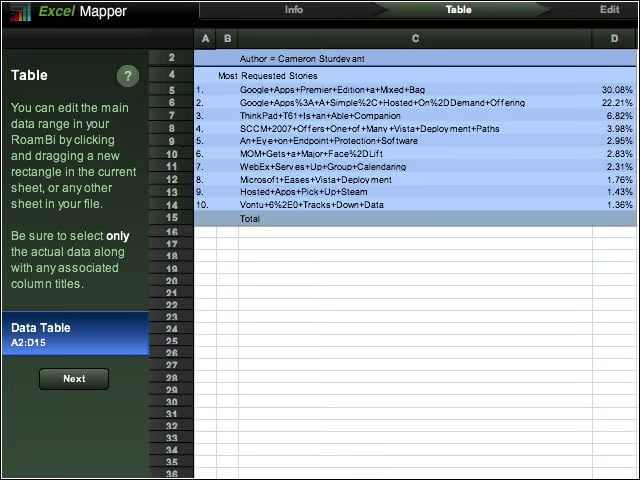
I cleaned up a Microsoft Excel spreadsheet before importing it into RoamBi Publisher. However, I did subsequently exclude the row numbers on the far left side from the final report.
More Data Selection
RoamBi automatically selected the relevant data for the report. I was able to further adjust this selection to fine-tune the final report appearance.
iPhone View Main Menu
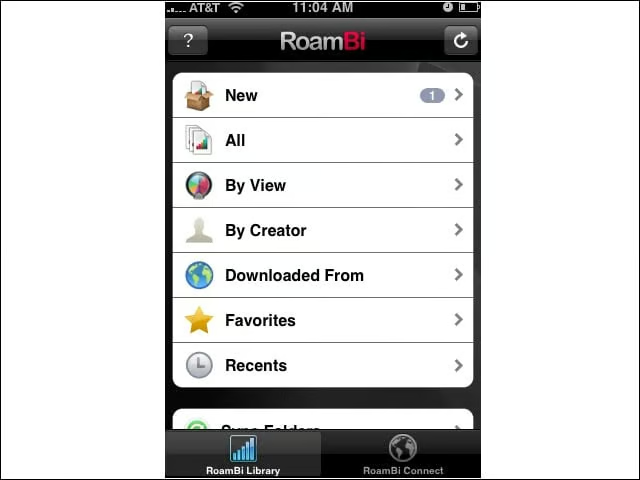
The following screens were taken from my iPhone. Here, you see the main menu after accessing the RoamBi app. You can see that a new report is available.
Specific Report
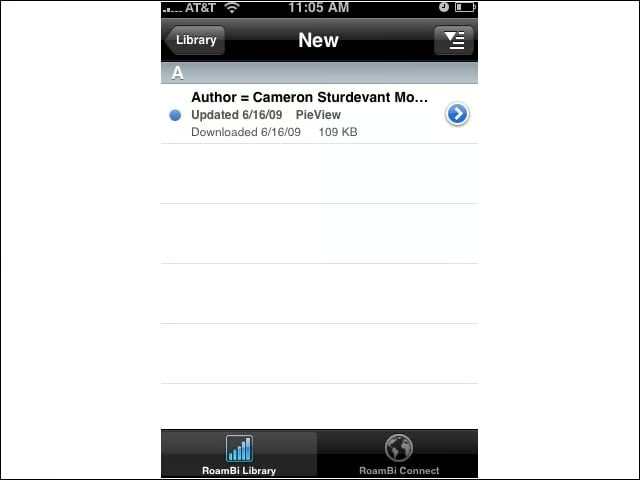
The new report details page hits for my stories published on eWEEK.com in June 2007.
Pie Chart
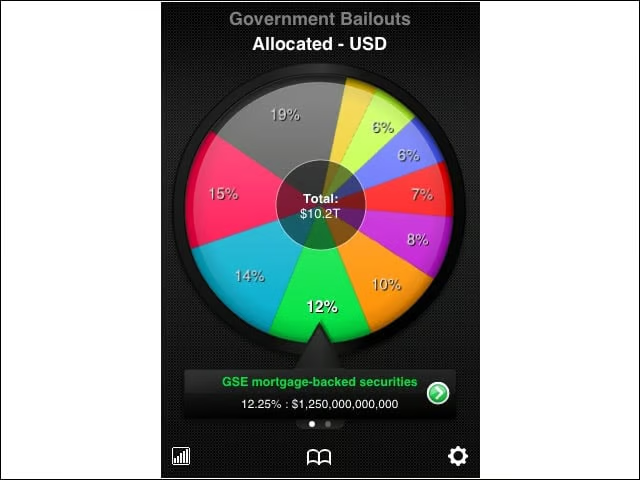
Here you see data from RoamBi sample data. (The page hit data was too sensitive to use in the screenshots.) The wheel spins and detailed information changes at the bottom of the screen depending on which piece of the pie is indicated by the pointer.
Drill Down
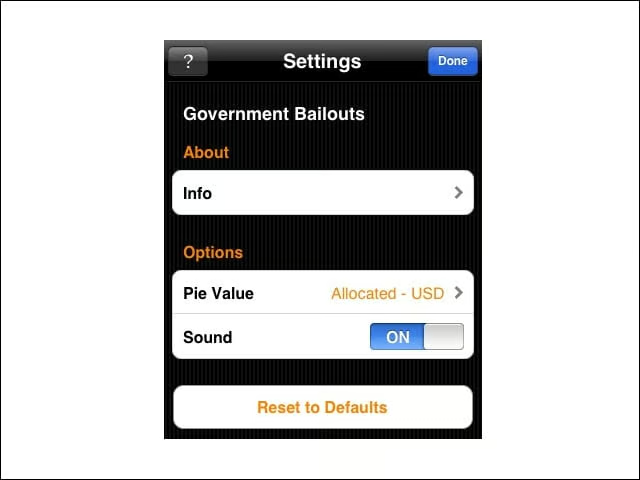
Tapping on the selected wedge yields more detailed data.
