


iLuminate Takes a New Data Warehouse Tack

by Jason Brooks
Data Statistics
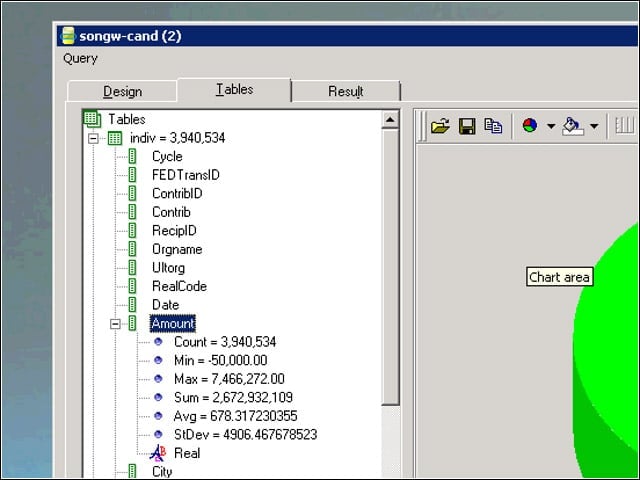
I used Illuminate’s iCorrelate analysis tool to drill down into tables, columns or query results, and view statistics on the information.
Expression Generator
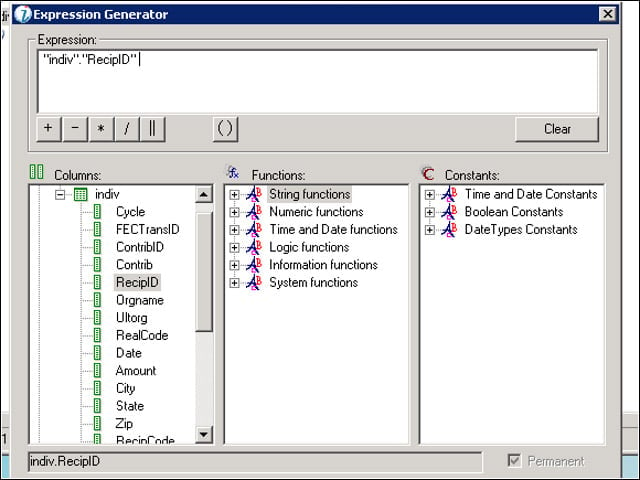
I used iCorrelate’s expressions feature to create two copies of the recipient ID columns.
Table Relationships
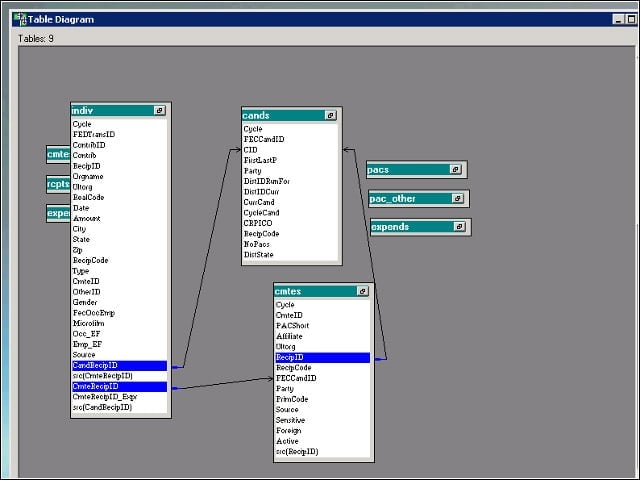
I linked one of the copied columns to the candidates table and the other to the committees table to use the tool’s Get Relations and Find Relations query options.
Find Relations
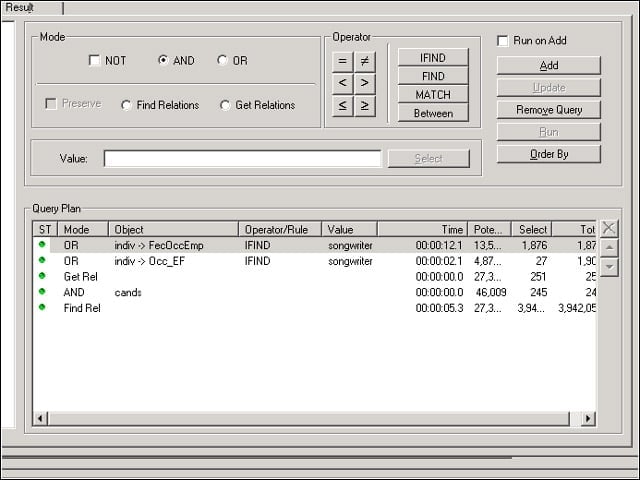
I used the tool’s Find Relations option to locate all the records that pointed to my results set of candidate entries.
Data Loading Tools
Before I could begin exploring my campaign data, I had to load it into the iLuminate engine, a task for which Illuminate offers two tool options: the iLuminate Importer and iLook & Load.
iLook & Load
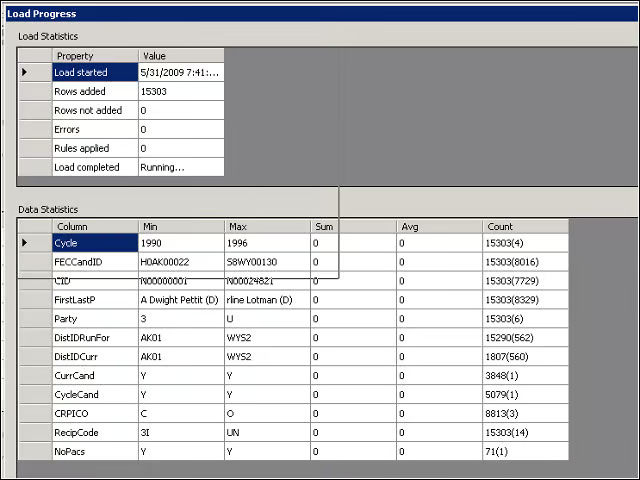
Of the two tools, iLook & Load provided more information about my data as it entered the system, such as the totals and averages of integer-typed columns and the maximum and minimum values of individual columns.
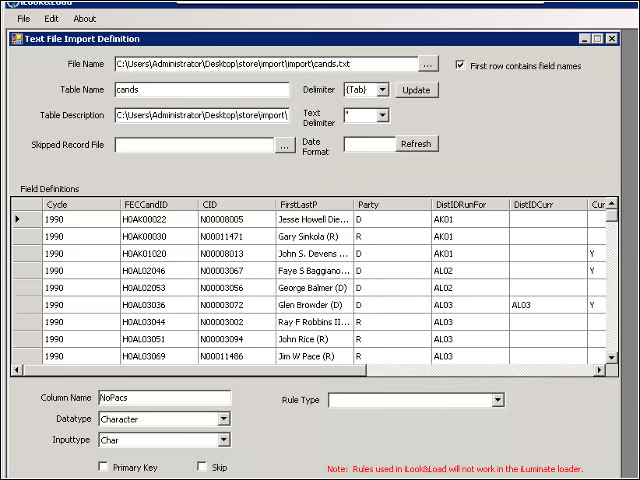
iLuminate Importer
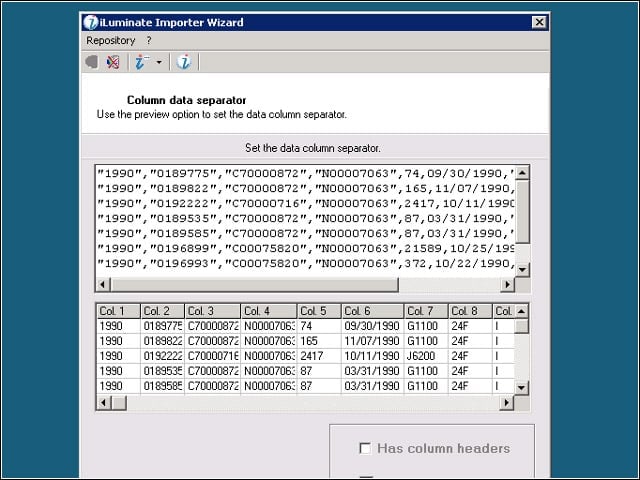
The stock importer tool performed faster than iLook & Load, handling my 15 million-record individual contributions table in about an hour and a half, compared with about five and a half hours with iLook & Load. In either case, the engine indexes all the data at load time.
ODBC Connectivity
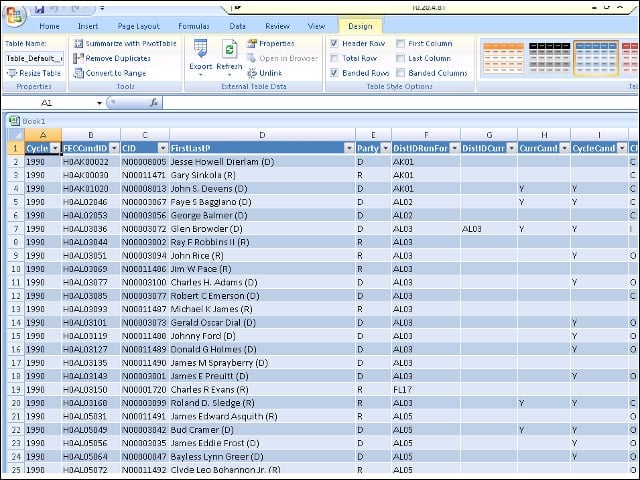
I could access any of my tables or stored queries through an external application (in my case, Microsoft Excel) via ODBC.
Train-of-Thought Queries
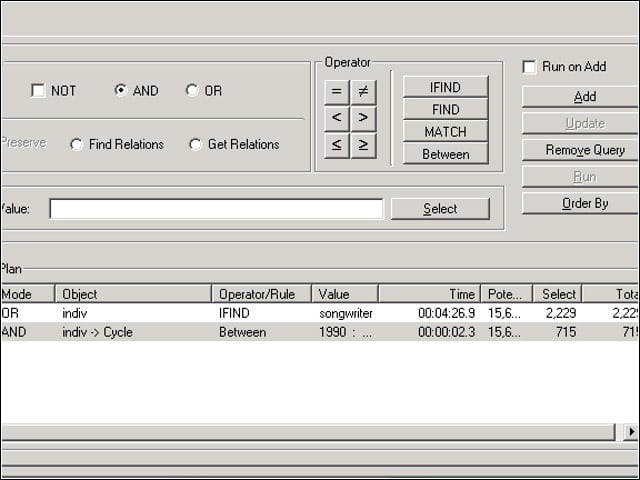
When one of my queries covering the 1990 to 2008 election cycles turned up only results after 2002, I modified my query and went in search of those missing results.
Service Monitor
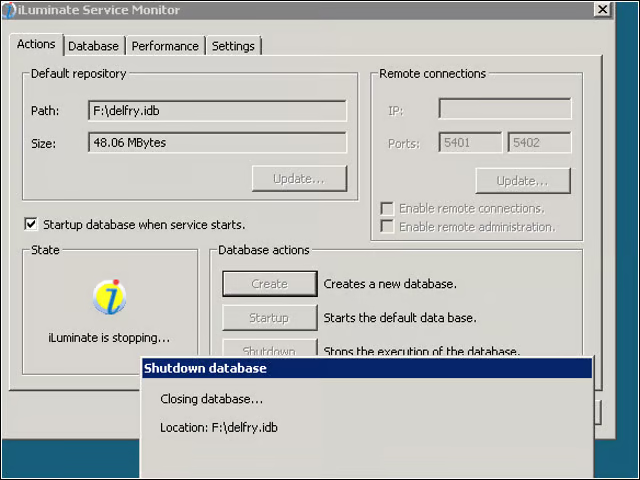
I could start, stop, create and switch among database files using a service monitor tool that would minimize to my system tray.
Charts and Reports
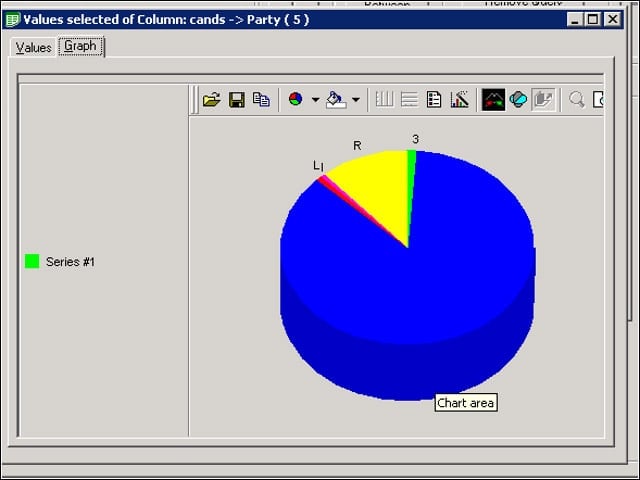
I could generate typical chart types within iCorrelate, as well as export my data sets to CSV files and create reports.
