


- Ericsson Report Shows Meeting of Mobile Traffic and Mobile Habits
- Mobile Subscription Additions, Q1 2013
- Global Subscription Penetration
- Mobile Traffic by Region, 2018
- Smartphone and PC Mobile Traffic, 2012 Versus 2018
- Traffic Drivers
- Minutes of Network Use (MoNU)
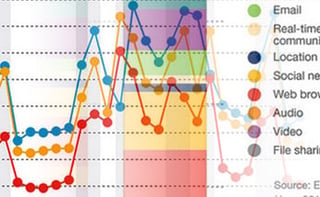
- Mobile Traffic Share by Application Type, 2012
- Data Penetration for Roaming Data Subscribers
- Local Mobile Broadband Subscribers
- Coverage by Technology
- What We Use and When
- Cultural Differences
Ericsson Report Shows Meeting of Mobile Traffic and Mobile Habits
by Michelle Maisto
Mobile Subscription Additions, Q1 2013
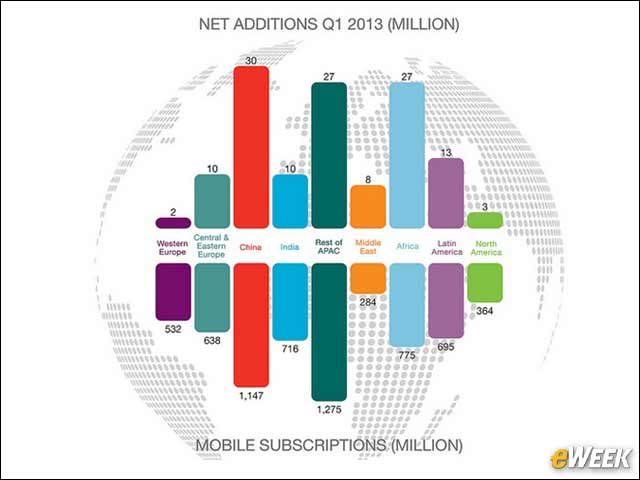
During the first quarter, 130 million new mobile subscriptions were created, bringing the global total to 6.4 billion. China led, adding 30 million, followed by the rest of Asia-Pacific and Africa.
Global Subscription Penetration
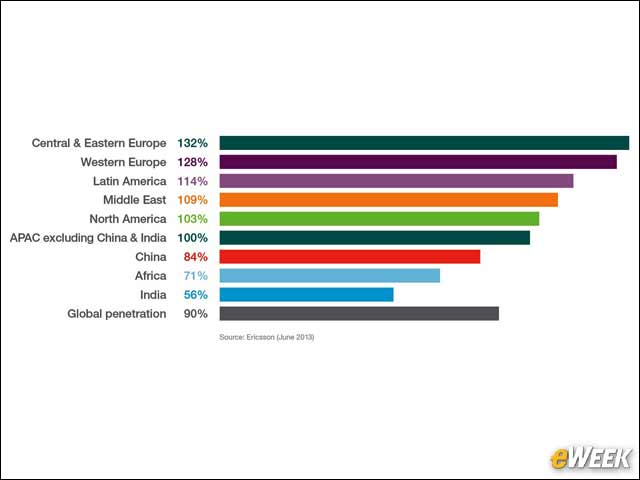
Subscriptions vary from subscribers, given that many subscribers have multiple subscriptions. The subscription penetration rate during the first quarter reached 103 percent in North America, 132 percent in Central and Eastern Europe, and 84 percent in China.
Mobile Traffic by Region, 2018
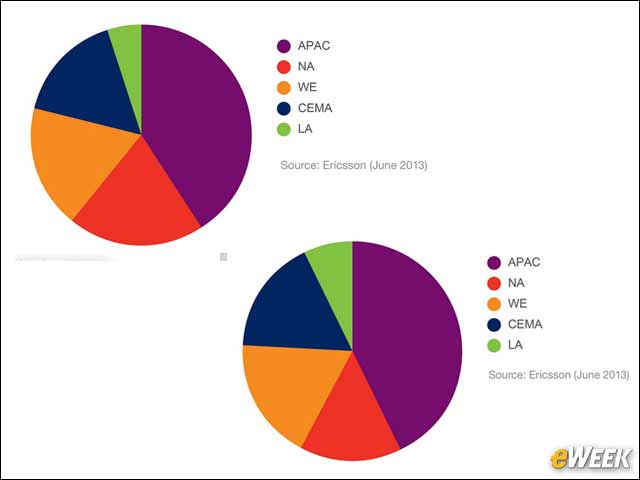
These pie charts compare mobile traffic shares by region in 2012 and as projected in 2018. In 2018, Latin America is expected to slightly increase its share and Western Europe and the Middle East show little change, but North America’s piece of the pie will shrink, given the growth in the Asia-Pacific region.
Smartphone and PC Mobile Traffic, 2012 Versus 2018
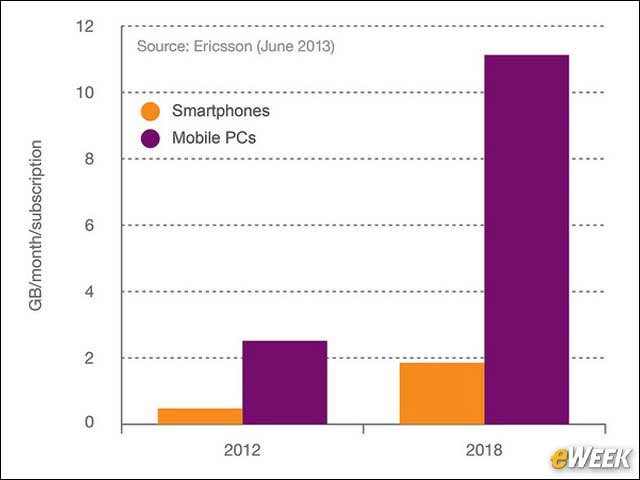
Mobile data traffic is expected to grow at a compound annual growth rate of about 50 percent, driven mostly by video. Mobile PCs generate approximately five times more traffic than smartphones, said Ericsson, accounting for the significant growth in gigabytes per user per month that it expects to see by 2018.
Traffic Drivers
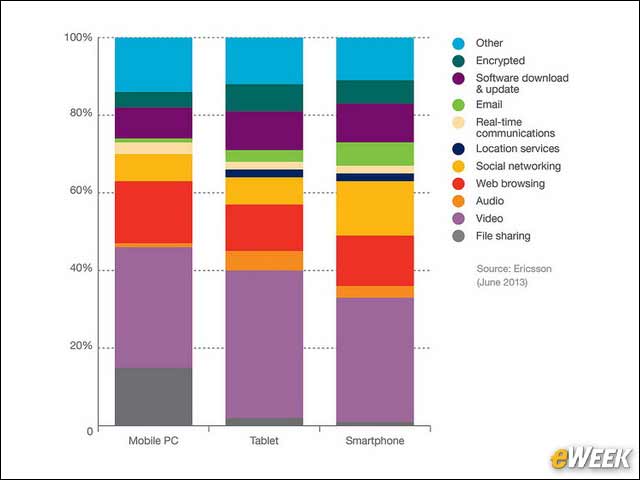
This chart includes 2G, 3G and 4G traffic; it doesn’t account for WiFi offloaded traffic. Across all form factors, video is the major contributor of mobile data traffic.
Minutes of Network Use (MoNU)
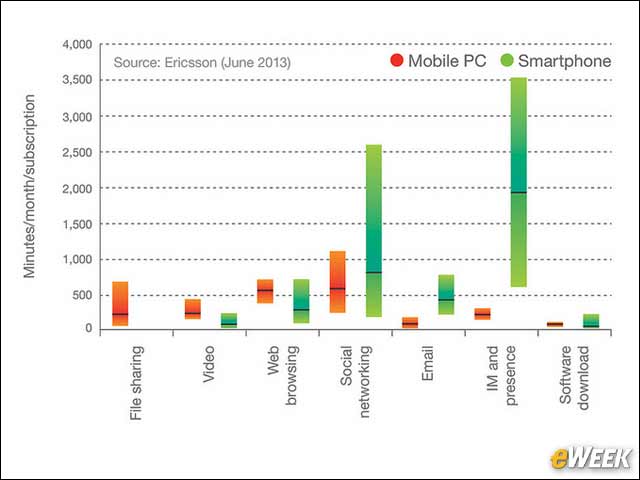
While video is the main traffic driver, social networking is a major contributor to MoNU. The Ericsson report points out that Facebook isn’t only used for social networking but for authentication for games and other apps.
Mobile Traffic Share by Application Type, 2012
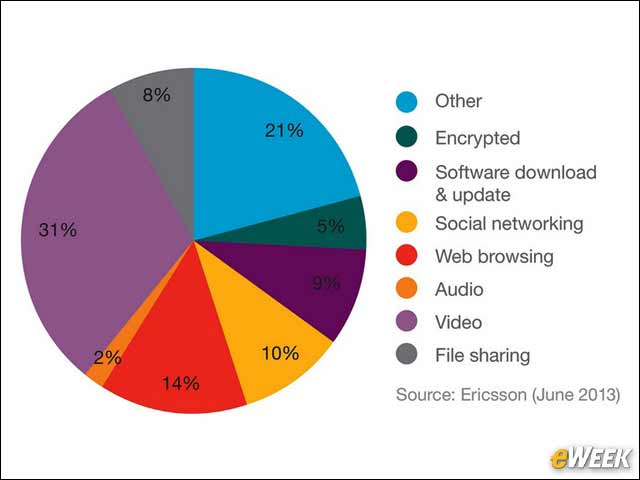
Mobile video currently accounts for 31 percent of traffic; by 2018, Ericsson expects that to grow to 46 percent. Web browsing, now 14 percent, is expected to fall to 10 percent, and file sharing will decrease to half of what it is now.
Data Penetration for Roaming Data Subscribers
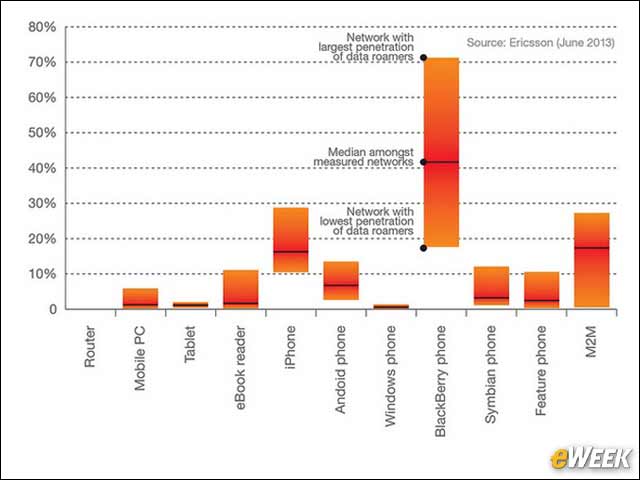
Business subscribers are less sensitive to roaming fees, explaining the high BlackBerry penetration in data roaming measurements, says the report.
Local Mobile Broadband Subscribers
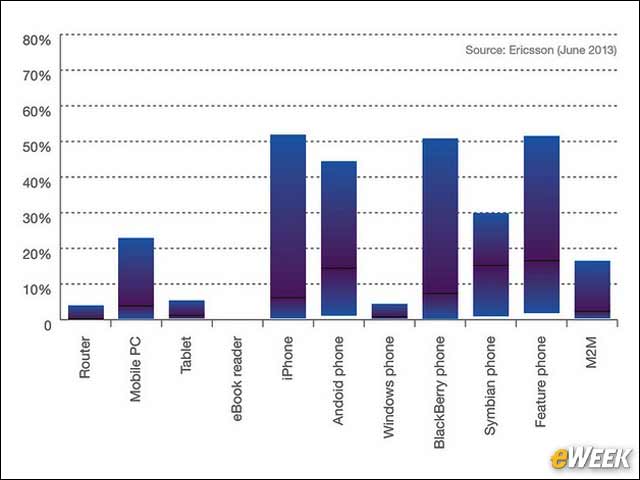
When looked at locally, device penetration changes significantly, particularly with the iPhone making its presence felt.
Coverage by Technology
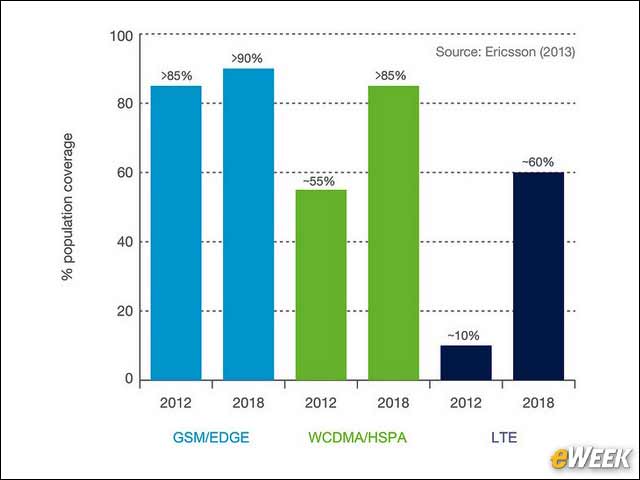
The greatest anticipated network change is that LTE, currently covering 10 percent of subscribers, will cover 60 percent by 2018.
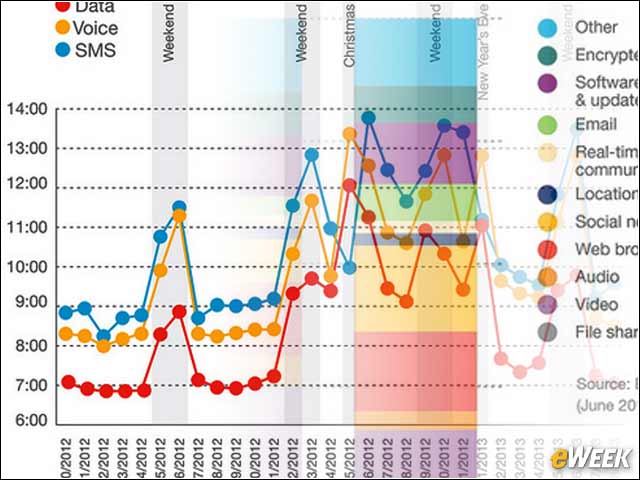
What We Use and When
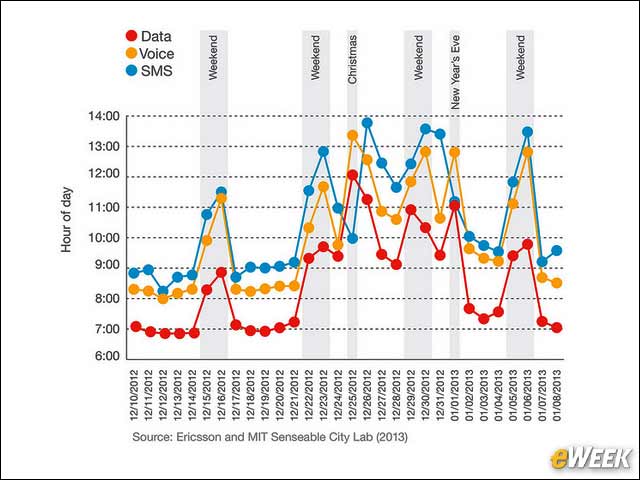
This chart tracks the time when activity for each technology picks up. The study found that people turn to data first—checking emails and weather as soon as their eyes open—voice next, as calls are placed as they head to the office or arrive, and finally SMS, with text messages likely following up conversations initiated earlier via data or voice.
Cultural Differences
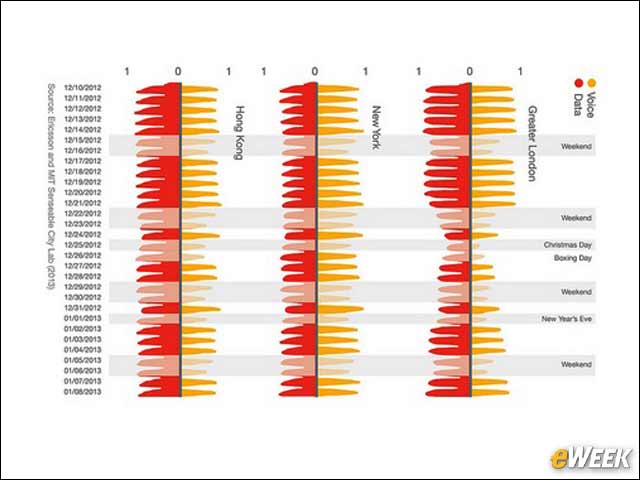
Ericsson tracked voice and data traffic between Dec. 10, 2012 and Jan. 8, 2013 in Hong Kong, London and New York. In Hong Kong, data traffic stayed active at night, while voice fell off. In London, both figures fell dramatically, suggesting a commuting population leaving London’s financial district. New Yorkers, however, were found to maintain their levels of data and voice use, day and night.