


- Working With the Visual TruView Management Console
- Visual TruView Includes a Customizable Dashboard
- Application Performance Dashboard
- Assessing Application Usage
- Monitoring Site Performance
- Site Traffic Analysis
- Application Analysis
- Drilling Down Into Application Charts and Details
- Network Performance Dashboards
- Tracking Network Device Loads
- VOIP Troubleshooting and Monitoring
Working With the Visual TruView Management Console
The management console is fully customizable and offers a single-pane-of-glass view into network operations. At a glance, administrators can determine performance, identify bottlenecks or recognize application problems. The console, which is based on HTML5, offers menu selections that focus on recognizable issues, easing the identification and troubleshooting process.
Visual TruView Includes a Customizable Dashboard
A fully customizable dashboard lets administrators define what information should appear. Building a dashboard uses a simple click-and-drag action that leverages gadget-like elements to populate the dashboard with information that supports real-time updating. Administrators can define multiple dashboards as needed.
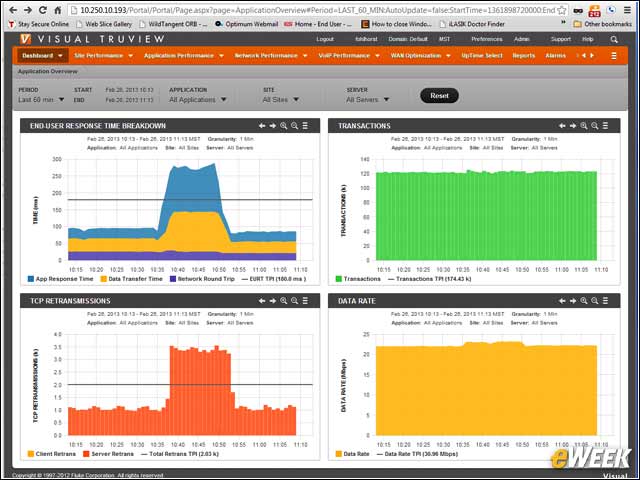
Application Performance Dashboard
Dashboards can be created for a variety of reasons. The dashboard pictured here shows the performance of multiple applications and their related infrastructure delivery methods. Colors are used to relate applications to their performance stats, while graphs are used to compare the various elements that define performance.
Assessing Application Usage
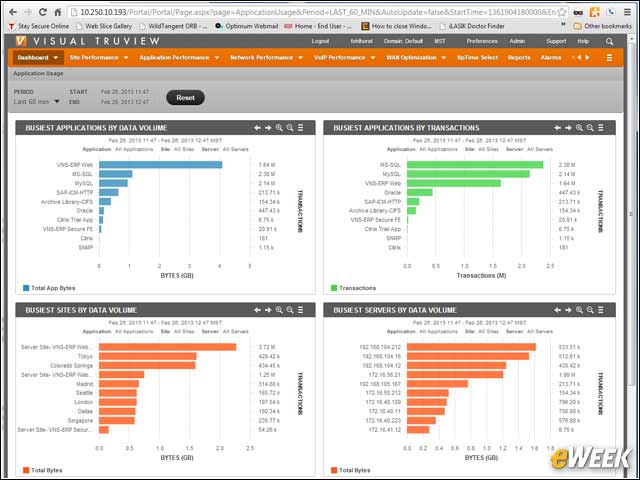
The dashboard shown here gives an instant assessment of what applications are in use and the impact of those applications on network traffic flow. The visual representation used makes it very easy to identify troublesome applications and how much data and traffic those applications use.
Monitoring Site Performance
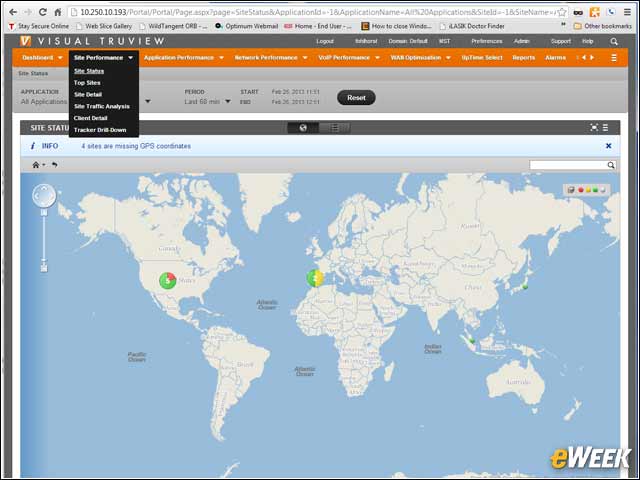
The Site Performance pull-down menu offers several options for investigating performance and other issues. The site status dashboard shown here gives a worldwide view of monitored sites, which can be drilled down further into for more analysis.
Site Traffic Analysis
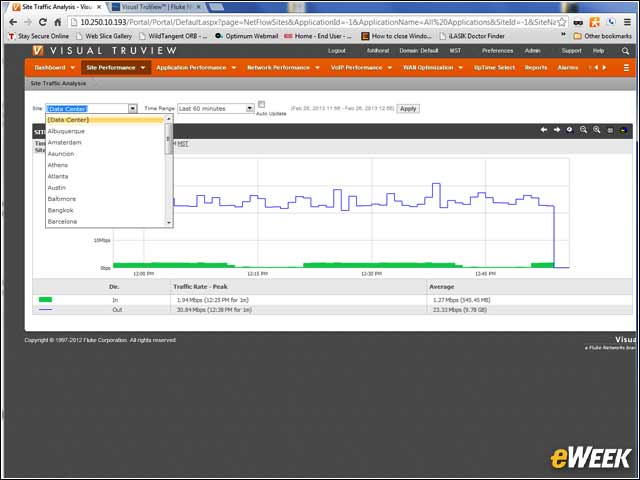
The site traffic analysis dashboard offers detailed information on traffic flow for a selected site. Average transfer rates are presented, as well as a time line, which shows peaks and valleys of traffic. Traffic direction is also recorded, giving an idea of what type of asymmetrical performance a particular site may need.
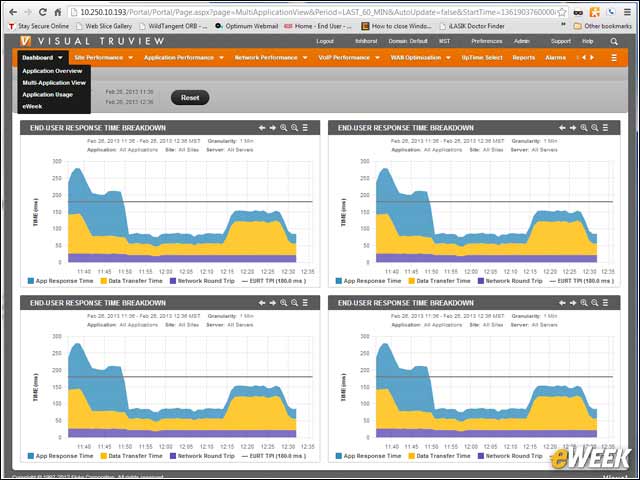
Application Analysis
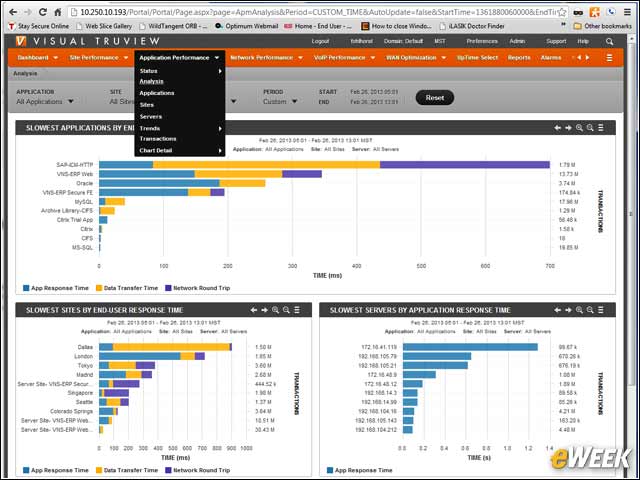
The Application Analysis dashboard offers a multitude of options for determining application performance. Here, an administrator can quickly identify the performance of applications, servers hosting those applications and sites hosting the servers. What’s more, information can be correlated to determine where a performance problem lies, just by looking at the graphs and drilling down into the target content.
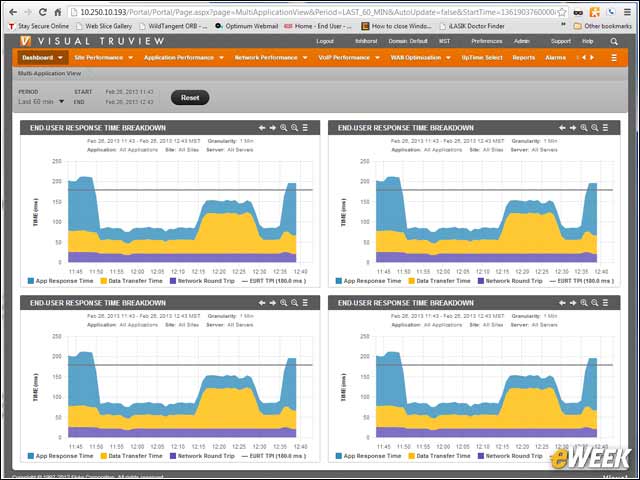
Drilling Down Into Application Charts and Details
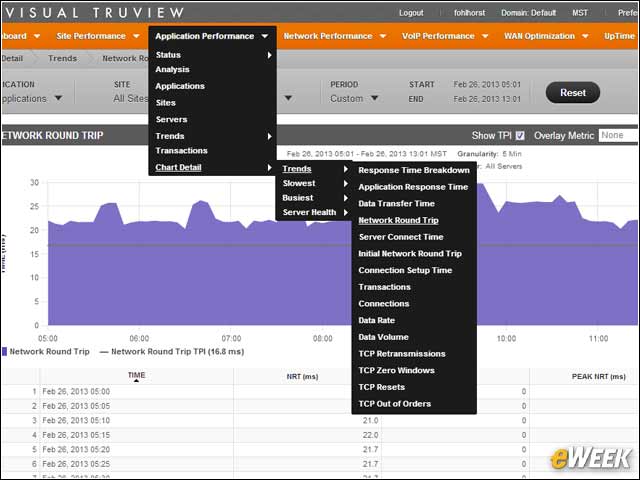
The multilayered menu system allows administrators to drill down into details, such as packet round-trip times, transactions and so on. The various screens prove invaluable for troubleshooting a problem by helping narrow down the cause and provide the investigative detail to back up or disprove assumptions about network performance problems.
Network Performance Dashboards
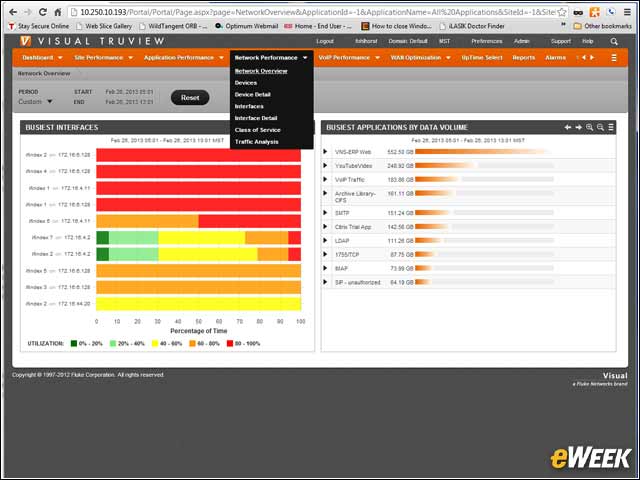
Visual TruView offers several visual representations of network performance. Here, a summary chart offers information on applications, networks, servers and so forth—making it easy to determine how the various applications and components that make up a network operation affect performance.
Tracking Network Device Loads
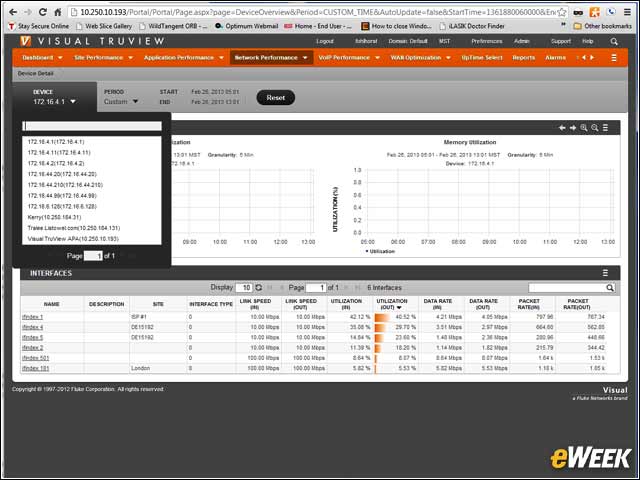
The network performance detail screens include information on individual devices, allowing administrators to drill down further into the performance of the hardware and the loads placed on that hardware to determine if a performance problem is related to the CPU, applications or traffic.
VOIP Troubleshooting and Monitoring
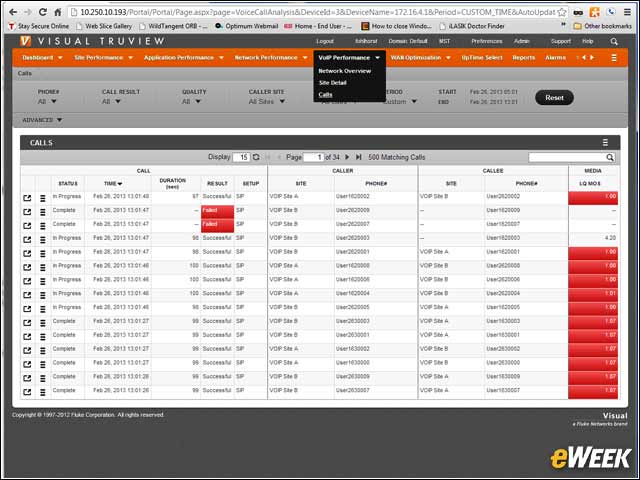
Visual TruView offers extensive VOIP monitoring and troubleshooting capabilities, making it easy to resolve problems with call quality jitter, dropped connections and so on. The VOIP calls dashboard shown here offers all of the critical information related to a call and allows drilldown into the VOIP packet details to aid troubleshooting chores.