


Google Data Studio and Tableau are both packed with data analytics features and business intelligence capabilities that help organizations gain insights – and innovate. Clearly, as businesses focus on digital transformation, this ability to mine data for knowledge and guidance is critical.
Both Google Data Studio and Tableau offer attractive dashboards with rich graphics, and they’re both adept at ingesting, manipulating and processing data. GDS and Tableau are two of the key tools used as data analytics trends reshape business.
However, there are also key differences in these data analytics applications. Sorting through the various options – along with strengths and weaknesses – is critical. Depending on your organization’s IT framework, your budget and how it approaches BI and analytics, either Google Data Studio and Tableau may stand out.
Also see: Top Business Intelligence Software
- Google Data Studio vs. Tableau: Feature Comparison
- Google Data Studio vs. Tableau: Comparing Data Visualization
- Google Data Studio vs. Tableau: Functionality Comparison
- Google Data Studio vs. Tableau: Comparing Security
- Google Data Studio vs. Tableau: Usability and Support Comparison
- How do Google Data Studio and Tableau Prices Compare?
- Should You Choose Google Data Studio or Tableau?
Google Data Studio vs. Tableau: Feature Comparison
It’s no surprise that Google Data Studio works best with Google software, tools and systems, including BigQuery, Google Analytics and Firebase. Native support for many of its own data formats makes GDS a natural choice for organizations that rely on Google Cloud and various other Google apps. Integrations are simple and work well.
However, using the platform with other software and tools can present challenges – including the need to rely on third party connectors and integration tools, sometimes available at an additional cost. For instance, the platform does not natively support Microsoft Excel files. Importing them requires additional steps and manipulation, including converting them to a Google Sheet document or a CSV file.
Google Data Cloud also doesn’t always play nicely with other vendor’s cloud data. Importing this data into GDS may also require additional steps or software. On the upside, the platform integrates with upwards of 150 cloud SQL, e-commerce and digital advertising platforms.
It’s no accident that Tableau has emerged as a leading data analytics solution. The application connects to a vast array of data sources, including Microsoft Excel, SQL Server, Google BigQuery, Snowflake, SAP HANA, Salesforce, Splunk and Amazon Redshift.
Furthermore, Tableau is equally adept at grabbing data from all the major players in the cloud-based data storage space, including Google Drive, Microsoft OneDrive, Dropbox and Box. Another advantage of Tableau is that it’s part of Salesforce. As a result, the BI software connects and integrates with Salesforce at a deep level. One of the strengths of Tableau is that it also seamlessly integrates with Slack and has a variety of other connectors designed for data science, business applications and other tasks.
Tableau is equipped to ingest large volumes of data and delivers models on Windows, Macs, iOS and Android devices. Its versatility – including integrations with various dashboards and web portals – is a big plus.
Also see: Top Business Intelligence Software
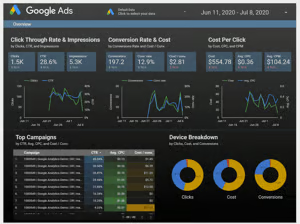
A dashboard in Google Data Studio.
Google Data Studio vs. Tableau: Comparing Data Visualization
Google Data Studio’s TBI and data visualization solution is adept at delivering attractive charts, graphics, geo maps, heat maps, bullet charts, pie charts, pivot tables, scorecards and numerous other representations. It offers dashboards that tie together various data sources and data streams, typically from Google applications or online advertising data sources.
This makes it ideal for viewing business and marketing metrics that are more digitally focused, including things like ad spend, site traffic, and search rankings. GDS allows users to customize reports and dashboards, including adding logos, icons and other properties.
GDS also delivers built-in comparison features that make it easy to view changes over time. However, the solution requires an Internet connection to operate effectively, and it only supports about 50 major functions – much less than Tableau.
Tableau’s data visualization platform has emerged as a market leader for a very clear reason: it transforms data into attractive and useful charts, graphics, infographics, heat maps, cluster maps and much more. The platform – which is designed for both data scientists and casual business users – makes it possible to create, modify and adapt visuals to match nearly any need or situation.
Tableau includes powerful interactive visual exploration and analytics and dashboard tools. However, the powerful visualization features that Tableau offers also come at a price: the platform is complex. It has a much steeper learning curve than GDS. It’s best suited for medium to large enterprises that have more sophisticated requirements and staff dedicated to generating visuals.
Also see: Top Data Mining Tools
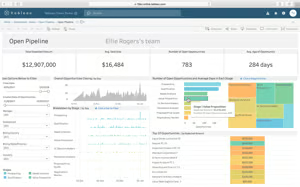
A dashboard in Tableau.
Google Data Studio vs. Tableau: Functionality Comparison
An advantage of Google Data Studio is that it delivers a simple and clean interface that’s relatively easy to use. The disadvantage is that the platform doesn’t accommodate the highly complex functionality, interactivity and reporting that Tableau supports.
Nevertheless, GDS is a flexible and powerful BI tool. The cloud-based solution is fast and efficient, and it includes excellent automation features, including scheduled updates and reporting. It also allows limited customizations for those who don’t mind working with code. Finally, because GDS resides in the cloud, Google constantly updates the solution and adds new features.
The Tableau platform offers five versions: Tableau Desktop, which is used to create and edit reports; Tableau Public, which allows users to share visualizations; Tableau Server, an external sharing tool; Tableau Online, a cloud version of the software; and Tableau Reader, which allows anyone to view a visualization or report.
Tableau delivers fast data processing, supports large numbers of concurrent users, and consumes minimal system resources. It also offers an array of advanced features and functionalities. This includes data cleansing capabilities, which are absent from GDS, and native connectivity with a wide range of databases, cloud resources, CRM systems such as Salesforce, and file types, including Excel.
This makes it easier to ingest data and export files and data. Because the solution works without an Internet connection, it’s ideal for those traveling or working offline at times. Tableau also delivers stronger and better collaboration options than Google Data Studio.
Also see: Top Data Visualization Tools
Google Data Studio vs. Tableau: Comparing Security
Security controls within Google Data Studio include password-enabled sharing options for visualizations and reports. GDS also supports Secure APIs for data connections. However, because the solution operates in a public cloud, anyone who has access to the space can view and download data. Likewise, the public cloud framework limits privacy options and controls.
The Tableau BI platform offers broader and deeper security controls than GDS. This includes multifactor authentication and granular Row Level Security. However, the way that an organization uses Tableau matters. For instance, those sharing workbooks and visualizations in Tableau public cloud have fewer controls. Essentially, anyone in the cloud can view and download reports and data. The platform also offers stronger privacy controls and options.
Also see: Top Digital Transformation Companies
Google Data Studio vs. Tableau: Usability and Support Comparison
Installing Google Data Studio is easy and painless. It’s a simple download followed by a login to a Google account. This makes it ideal for SMBs and others looking for fast, efficient and robust BI visualizations without a lot of overhead. Using the BI tools is relatively easy, though the platform has some size and flexibility limitations. Those that use other Google products, such as Google Docs, will find the controls and settings familiar. The platform has a large online community and offers a robust knowledge base with videos and other tools. However, there is no phone or live support for GDS.
While the Tableau BI solution delivers unsurpassed capabilities, this comes at a cost. The learning curve for Tableau is much steeper than GDS. In order to use more advanced functionality, there’s typically a need for training. Fortunately, Tableau has an enormous online community, and it offers substantial online resources, including a knowledge base, to aid in using its products.
The vendor’s support options include standard support (available between 8 a.m. and 5 p.m.), which is included in a subscription purchase, extended support that includes 24×7 live support (including weekends), and premium support, which offers extended availability and prioritized service from a senior support team.
Also see: Top Cloud Companies
How do Google Data Studio and Tableau Prices Compare?
A big draw for Google Data Studio is its price: free. It simply requires a Google account.
Depending on your BI requirements, Tableau can range from affordable to expensive.
Tableau’s tiered pricing model includes a free version, Tableau Public, which offers limited storage and privacy options. Fully featured Tableau Creator, which can run in the cloud or on-premises, costs $70 per month (billed annually). It includes the desktop software and Tableau Prep Builder, which is used to create visualization.
Tableau Explorer, which includes a single Tableau Server license, costs $35 per month (billed annually) is on-premises and costs $42 per month (billed annually). Tableau Viewer, which allows users to view visualizations, costs $12 per license, billed annually.
The bottom line is that the Tableau solution is pricey. The typical cost of a license is between approximately $800 and $2,000 per year.
Also see: Top AI Software
Should You Choose Google Data Studio or Tableau?
Both Google Data Studio and Tableau deliver robust visualizations through dashboards and other tools. If you’re on a tight budget and have limited BI requirements, Google Data Studio is most likely the tools for you. It offers the additional advantage of delivering a user-friendly and easy-to-use interface.
If on the other hand, your organization has more complex requirements and a need to manage broader and more varied data sets, Tableau is more likely to fit the bill. It can tackle nearly any type of BI and data analytics requirement, it includes strong built-in security features, and it makes sharing attractive visualizations easy.
Also see: Data Analytics Trends