


IBM Brings Big Data Analytics to the Masses Anywhere, Anytime

By Darryl K. Taft
Analytics Penetrating All Areas

Gartner predicts that analytics will reach 50 percent of potential users by the end of 2014. By 2020, that figure will be 75 percent, and we will be in a world where systems of record, systems of differentiation and systems of innovation are enabling IT, businesses and individuals to analyze data in a much denser fashion than before. Post-2020 we’ll be heading toward 100 percent of potential users and into the realm of the Internet of everything.
Meeting the Frontline Challenge

The challenge for most organizations? Taking analytics out of the IT department and making it accessible to frontline staff, like sales, through visualization tools and dashboards. Frontline managers have the best understanding of how analytics can help them improve performance. The best performing IT departments don’t push analytics down to the frontline, but rather listen to the frontline and then create and pull analytics based on their recommendations.
Analytics on the Go

Analysts estimate that 29 percent of the global workforce are anytime, anywhere information workers who use three or more devices, work from multiple locations and use many apps. This number has risen from 23 percent of the global workforce in 2011 and will continue to rise, as we will see 905 million tablets in use for work and home globally by 2017. Some vendors are addressing the vision of “analytics everywhere” by making sophisticated analytics more accessible, easier to use and available at any location at any moment to meet the changing needs of the anytime workers.
Analytic Discovery Software

IBM recently previewed analytic discovery software on the cloud that lets business users visually interact with and apply advanced analytics to big data without needing the skills of a data scientist. This gives line-of-business professionals in sales, marketing, finance and other areas the ability to easily interpret predictive insights from data in real time.
IBM Project Catalyst Insight
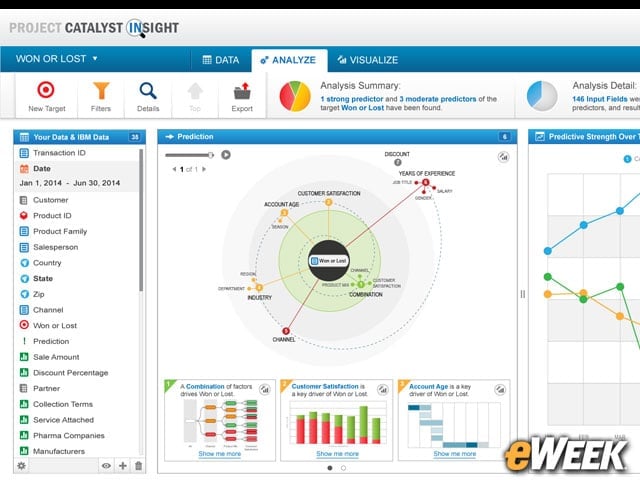
IBM’s Project Catalyst Insight makes analytics more automated, approachable and accessible to business users. It automatically builds predictive models and presents those results as interactive visuals with plain language descriptions. Using this type of tool, a marketing manager could use advanced analytics to better understand the drivers of marketing campaign effectiveness without having to wait for a data scientist to prepare the information, develop predictive models and interpret the results.
IBM Concert Dashboard
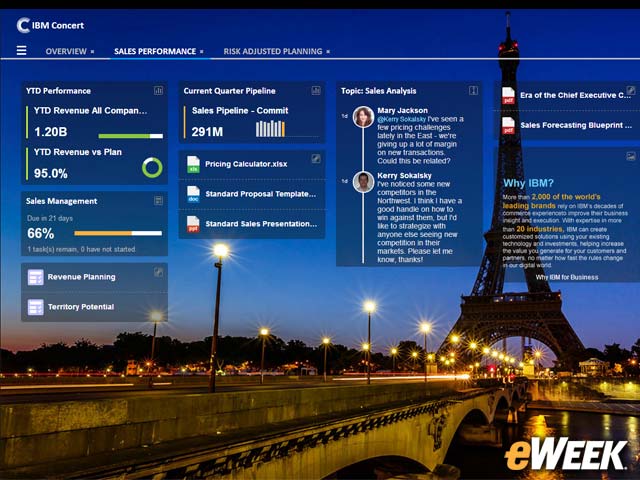
IBM Concert brings together task-personalized lists, dashboards, analysis and reporting in the cloud so employees can interact with and understand their data and collaborate with others. For example, a sales manager looks at the Concert dashboard and sees that sales for one product line are running behind the plan for the current quarter. The manager immediately recommends an additional sales incentive, attaches a few comments and asks for senior management approval as part of an established process. The CFO, who is out of the office, can use a smartphone to access the expense alert, read all the comments and review in-context metrics to approve the request.
Analytics and the Bottom Line

Why the interest? Analytics represents a major opportunity for ROI and organic growth for organizations. A 10 percent increase in data accessibility translates into an additional $65.7 million in net income for a typical Fortune 1000 company, IBM estimates.