







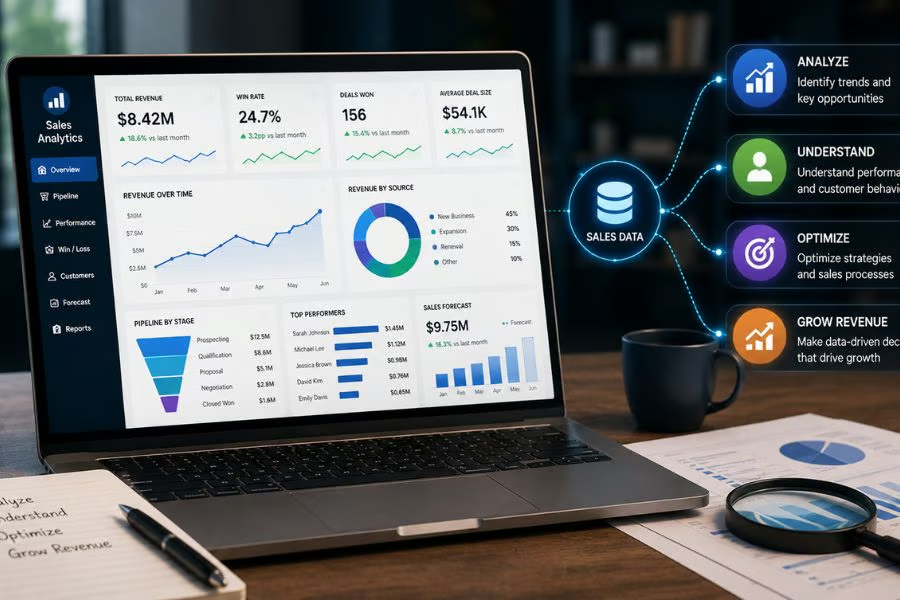
Sales teams generate data across CRM records, prospecting activity, buyer conversations, pipeline updates, marketing engagement, and closed deals. The challenge is turning that information into clear decisions about where revenue is coming from, where deals are slowing down, and what deserves attention next.
Sales analytics helps revenue teams connect those signals to pipeline health, forecasting, seller performance, conversion, and account prioritization. The goal is to move beyond reporting what happened and use the data to decide where teams should focus and act.
For teams that need stronger company, contact, and intent data to support targeting and prioritization, ZoomInfo can add valuable account and buyer context to their analysis.
- What is sales analytics?
- What sales data do revenue teams analyze?
- Types of sales analytics
- What is sales analytics used for by revenue teams?
- Sales analytics metrics revenue teams should track
- How to build a sales analytics process
- What to look for in sales analytics technology
- Common sales analytics mistakes
- How AI is changing sales analytics
- Turning sales data into revenue decisions
What is sales analytics?
Sales analytics is the process of collecting, organizing, analyzing, and interpreting sales data to understand performance and guide revenue decisions. It connects individual records and metrics to broader questions such as why conversion changed, whether the pipeline is healthy, which segments perform best, and whether the team is likely to hit its target.
Understanding what sales analytics is in practice requires separating three related concepts:
- Sales data: The underlying information generated by sales and customer interactions, such as opportunity values, stage changes, calls, meetings, contacts, and closed deals.
- Sales metrics: Measurements calculated from that data, such as win rate, average deal size, pipeline coverage, and sales cycle length.
- Sales analytics: The interpretation of those measurements to identify patterns, explain outcomes, assess future performance, and guide action.
For example, a report might show that win rate declined quarter over quarter. Analytics goes further by determining whether the decline came from a particular segment, source, territory, sales stage, or deal type — and whether the team should intervene.
What sales data do revenue teams analyze?
Useful analysis rarely comes from one source. Modern sales organizations typically draw from CRM systems, sales engagement platforms, marketing automation, conversation intelligence, enrichment providers, customer systems, and financial tools. The data that a team needs depends on the question it is trying to answer.
CRM and opportunity data
CRM data is usually the foundation because it records the structure and movement of the sales pipeline. Common fields include:
- Account and contact records
- Opportunity value
- Pipeline stage
- Expected close date
- Opportunity owner
- Product or service
- Win/loss outcome
- Lead or opportunity source
This information helps teams understand how much pipeline exists, where opportunities sit, how quickly they move, and where revenue comes from.
The quality of those conclusions depends on CRM hygiene. Outdated close dates, missing account fields, duplicate records, inconsistent stages, and dead opportunities left open can distort the analysis.
Sales activity and engagement data
Activity data shows what sellers and buyers are doing around an opportunity. Depending on the technology stack, that can include:
- Calls
- Emails
- Meetings
- Tasks
- Responses and engagement
- Conversation activity
Activity becomes more useful when it can be connected with opportunity progression and outcomes rather than viewed as raw volume.
Account and buyer data
B2B revenue teams increasingly analyze external account and buyer information alongside CRM activity. This can include:
- Company size
- Industry
- Location
- Organizational structure
- Contact role and seniority
- Intent and buying signals
- Account engagement
- Relevant company changes
These inputs give revenue teams more context about the companies and people behind the pipeline.
Marketing and lead data
Marketing data helps connect demand-generation activity with pipeline outcomes. Revenue teams may examine:
- Lead sources
- Campaign engagement
- Marketing-qualified leads
- Sales-qualified leads
- Channel attribution
- Website engagement
- Lead-to-opportunity conversion
The goal is not simply to identify which channels produce the most leads. A more useful question is which sources create qualified opportunities that progress and generate revenue.
Revenue and customer data
Post-sale and financial data adds another layer to the analysis, including:
- Bookings
- Contract value
- Revenue
- Renewals
- Expansion revenue
- Churn
- Customer segment
- Product mix
Connecting these records with pre-sale data helps teams determine not only which prospects convert, but which types of customers ultimately create the most value.
Types of sales analytics
Revenue teams can analyze data at different levels of sophistication. A common framework separates analytics into descriptive, diagnostic, predictive, and prescriptive approaches.
Descriptive analytics: What happened?
Descriptive analysis summarizes current or historical performance. It answers questions such as:
- How much revenue did we close?
- What was our win rate?
- How much pipeline did we create?
- Which territories reached quota?
- How long did deals take to close?
These measurements establish a baseline but do not necessarily explain the result.
Example: A CRO sees that the enterprise team's win rate declined from the previous quarter. That identifies the change, but additional analysis is needed before deciding how to respond.
Diagnostic analytics: Why did it happen?
Diagnostic analysis investigates the factors behind a result.
Instead of stopping at a declining win rate, a team could segment results by opportunity stage, deal size, product, source, industry, or competitor. It might find that win rate remained stable for smaller enterprise opportunities but fell sharply for larger deals lost late in the cycle.
That diagnosis is more actionable than knowing only that the overall number changed.
Predictive analytics: What is likely to happen?
Predictive analysis uses historical patterns, current conditions, statistical methods, and increasingly machine learning to estimate future outcomes.
Revenue teams might use it to assess:
- Which opportunities are more likely to close
- Whether the quarter is likely to reach target
- Which accounts have higher conversion potential
- How much revenue the current pipeline may produce
Predictive analysis does not guarantee an outcome. Its value lies in helping managers assess likelihood and risk rather than relying solely on seller judgment.
Also read: Predictive Sales Analytics: Using AI to Drive Sales
Prescriptive analytics: What should we do next?
Prescriptive analysis uses available information to recommend or inform action.
A revenue team might use it to:
- Prioritize an account showing stronger buying signals
- Escalate a late-stage opportunity with declining engagement
- Investigate a sales stage where conversion has fallen
- Redirect resources toward a stronger-performing segment
- Recommend a next step based on deal history and buyer behavior
Revenue teams often use these approaches together, moving from what happened → why it happened → what may happen → what to do next.
Also read: 6 Best AI Sales Tools to Boost Your Revenue
What is sales analytics used for by revenue teams?
The most valuable applications connect data directly to recurring revenue decisions. Analytics should improve how leaders inspect the business and how sellers allocate their time — not simply produce more dashboards.
1. Monitoring pipeline health
Pipeline analysis helps leaders determine whether enough viable opportunities exist to support future revenue targets.
Common indicators include:
- Total pipeline value
- Pipeline coverage
- Pipeline created
- Stage distribution
- Deal age
- Opportunity movement
- Stalled opportunities
A large pipeline is not automatically a healthy pipeline. If much of its value sits in aging opportunities with no next step, the headline number can create false confidence.
Example: Pipeline coverage appears sufficient for the quarter, but a manager finds that many late-stage opportunities have had no recent activity or repeatedly changed close dates. The team can review those deals for removal, requalification, or intervention instead of treating all pipeline value equally.
2. Identifying conversion bottlenecks
Overall win rate tells only part of the story. Revenue teams can break conversion down by funnel stage, opportunity source, customer segment, product, territory, rep, or deal size.
This makes it easier to locate where performance is changing.
Example: If opportunities convert normally from discovery to evaluation but frequently stall before proposal, managers can investigate qualification, stakeholder access, pricing discussions, or other factors specific to that stage rather than broadly telling reps to close more deals.
3. Improving sales forecasting
Forecasting becomes more defensible when it combines seller input with actual pipeline behavior.
Useful inputs can include historical conversion rates, current pipeline value, stage progression, deal age, close-date movement, buyer engagement, opportunity history, and forecast categories.
This does not eliminate human judgment. Managers still need context that a model or dashboard may not capture, particularly for strategic opportunities. Analytics gives them additional evidence to challenge or validate the forecast.
Example: A deal may be listed as highly likely to close, but repeated close-date changes and declining buyer activity could indicate greater risk than the seller's forecast category suggests.
Also read: AI Sales Forecasting: Benefits and How-To Guide
4. Measuring seller and team performance
Performance analysis should connect activity with results rather than rank reps by volume alone. Revenue leaders may examine quota attainment, revenue generated, win rate, pipeline created, average deal size, stage conversion, sales-cycle length, and opportunity creation.
Comparisons also need context. Two sellers may have different performance profiles because they cover different territories, customer segments, products, or account portfolios.
Example: If one rep closes fewer deals but produces much larger contract values, measuring only deal count would understate that person's contribution.
5. Understanding which customers and segments perform best
Segment analysis can reveal where the sales motion works best. Teams can compare performance by industry, company size, geography, product, customer type, acquisition source, and deal size. Those findings can inform ICP development, territory planning, targeting, and resource allocation.
Example: A team may discover that midmarket healthcare companies have a higher win rate and shorter sales cycle than similarly sized accounts in another vertical. That finding can influence prospecting priorities without assuming every healthcare account is automatically a good fit.
6. Prioritizing accounts and opportunities
Reps have limited time, so one practical application of sales data analysis is deciding where to focus it.
Revenue teams can combine account fit with factors such as engagement, intent, stakeholder activity, opportunity history, and relevant company changes. This creates a more evidence-based prioritization model than simply sorting opportunities by value or expected close date.
Account prioritization also depends on reliable company, contact, and buying signal data. ZoomInfo can add account intelligence and intent context that helps revenue teams identify and segment higher-priority prospects.
7. Improving sales and marketing alignment
Shared analysis gives sales and marketing teams a common basis for evaluating pipeline contribution.
Instead of debating lead quantity, the teams can answer questions such as:
- Which sources generate qualified pipeline?
- Which campaigns lead to opportunities?
- Which segments convert at the highest rate?
- Where are leads dropping out?
- Which channels produce customers rather than just inquiries?
This shifts the discussion from lead volume and attribution toward revenue quality.
Sales analytics metrics revenue teams should track
A useful measurement framework starts with the business question rather than a long list of KPIs.
Business question | Useful metrics |
| Are we generating enough pipeline? | Pipeline value, pipeline coverage, pipeline created |
| Are opportunities progressing? | Stage conversion, deal age, pipeline velocity |
| Are we winning efficiently? | Win rate, sales cycle length, average deal size |
| Are sellers performing? | Quota attainment, revenue per rep, pipeline created per rep |
| Where is revenue likely to land? | Forecast value, forecast accuracy, pipeline coverage |
| Which sources and segments work? | Conversion by source, segment win rate, revenue by segment |
The right metrics depend on the sales motion. A high-volume transactional organization may care more about speed and conversion, while an enterprise team with long buying cycles may place greater weight on pipeline coverage, deal progression, stakeholder engagement, and forecast risk.
Metric definitions must also be consistent. If teams use different qualification criteria, pipeline stages, or conversion formulas, company-wide comparisons become less reliable.
How to build a sales analytics process
Technology matters, but a useful analytical process starts with the decision the team needs to make.
1. Start with a business question.
Define the decision the analysis needs to support before deciding which reports to build.
Example: Instead of requesting a general pipeline dashboard, ask, “Which opportunity stages are responsible for the increase in our sales cycle?” That determines which data and comparisons matter.
2. Define metrics consistently.
Document the qualification rules, stage criteria, forecast categories, attribution logic, and metric formulas so teams measure performance consistently.
Example: Before comparing stage conversions across regions, verify that all regions use the same criteria for entering and exiting each opportunity stage.
3. Identify the required data.
Determine which CRM, activity, marketing, account, customer, or financial records are necessary to answer the question.
Example: Analyzing enterprise sales cycle length may require stage history, deal value, stakeholder activity, and meeting data — but not every available marketing field.
4. Validate and connect the data
Check for missing fields, duplicate records, inconsistent stages, outdated opportunities, and disconnected account identities before analyzing results.
Example: If duplicate account records split pipeline and engagement activity, resolve them before comparing account-level performance.
5. Connect analysis to decisions.
Reports should help users investigate a change and determine what to do next.
Example: If win rate declines, managers should be able to drill into segment, territory, stage, and opportunity data to locate where the decline originated.
6. Review the framework as the business changes.
Update metrics and reporting when products, territories, sales stages, qualification rules, or go-to-market motions change.
Example: A company moving from lead-based selling to account-based selling may need to replace lead-volume reports with account engagement and opportunity-level measurements.
What to look for in sales analytics technology
Software should make analysis easier without creating another disconnected source of truth.
Prioritize capabilities based on the revenue problems the team needs to solve:
- Integrations: Connect the CRM and other systems containing the data required for analysis.
- Pipeline and conversion analytics: Examine pipeline movement, stage conversion, deal progression, and trends.
- Segmentation and drill-down: Move from aggregate metrics to teams, territories, accounts, and opportunities.
- Forecasting: Support forecast management, historical comparisons, pipeline inspection, and risk analysis where required.
- Data management: Help synchronize, enrich, or otherwise improve the records used for analysis.
- AI-assisted analysis: Where available, use AI to surface anomalies, summarize patterns, or identify potential risks.
- Governance and customization: Control metrics, permissions, reporting logic, and dashboards.
The right technology depends on the problem. A team struggling with incomplete account data has different requirements from one that already has reliable CRM data but needs stronger forecasting or conversation analysis.
Common sales analytics mistakes
Most failures are not caused by a lack of data. They happen when teams collect or report information without connecting it to a decision.
- Tracking metrics without a decision attached: More KPIs do not automatically create better insight. Focus on measurements connected to revenue questions and actions.
- Treating activity as performance: Calls, emails, and meetings matter only when they contribute to meaningful outcomes such as pipeline progression or conversion.
- Ignoring context: Territory, customer segment, product mix, and deal size can make simple rep or team comparisons misleading.
- Trusting poor-quality data: Missing fields, stale opportunities, duplicate records, and inconsistent definitions undermine the analysis built on them.
- Relying too heavily on averages: Company-wide averages can hide important differences among segments, territories, reps, and deal types.
- Confusing correlation with causation: Analytics can identify relationships worth investigating, but a behavior associated with successful deals does not necessarily cause the outcome.
How AI is changing sales analytics
AI can help revenue teams analyze larger volumes of structured and unstructured sales information. Common applications include summarizing conversations, detecting unusual pipeline changes, identifying deal risk, scoring accounts or opportunities, estimating outcomes, and allowing users to query revenue data through natural-language interfaces.
Predictive models can also evaluate more signals than a manager could reasonably inspect opportunity by opportunity. However, the usefulness of those outputs still depends on the underlying data and model. AI does not automatically fix inconsistent stages, duplicate accounts, missing records, or poorly defined metrics.
Revenue teams still need clear definitions, reliable data, appropriate governance, and human judgment when deciding how to act on AI-generated insights.
Also read: How Will Agentic AI Change Enterprise Data Management in 2026 and Beyond?
Turning sales data into revenue decisions
The goal of sales analytics is not to build more dashboards. It is to create a repeatable way to turn information into action:
Data → metric → insight → decision → action → outcome
Effective revenue teams can identify a performance change, trace it to its likely source, determine whether intervention is warranted, and measure what happens afterward. That is what separates reporting that describes the business from analytics that helps teams run it.