Business intelligence (BI) software tools help organizations analyze data to identify trends, events, and market changes. These tools collect, manage, and interpret vast amounts of structured and unstructured data to construct predictive models that deliver insights. BI systems integrate multiple data sources and include data extraction, cleansing, governance, and dashboards for reports and visualizations.
I evaluated the best AI-powered BI tools to assess their features, pricing, pros and cons, and use cases, to help you determine the best option for your business.
Here are my picks for the best AI-powered BI tools and systems for 2025.
- Microsoft Power BI: Best for AI-powered demand forecasting
- Domo: Best for real-time data unification
- Tableau Desktop: Best for interactive visual analytics
- Oracle Analytics Cloud: Best for enterprise-wide sales operations
- MicroStrategy: Best for contextual insights
- SAP Analytics Cloud: Best for risk management
Best AI-powered BI tools comparison
AI-powered BI tools enhance traditional business intelligence by using artificial intelligence to automate tasks, enable predictive analytics, and provide natural language query capabilities that make insights accessible to all users. The table below shows how the six leading AI-powered BI tools compare across key criteria, including features and price.
| Best for | Key features | Starting price (Billed annually) |
|
| Microsoft Power BI | AI-powered demand forecasting | Copilot AI (natural language & report generation) Anomaly detection and forecasting Interactive dashboards |
$14 per user, per month |
| Domo | Real-time data unification | AI chat for data queries AI model management Real-time data unification and collaboration |
Contact vendor |
| Tableau Desktop | Interactive visual analytics | Ask Data (natural language queries) Anomaly detection and forecasting Visual storytelling |
$15 per user, per month |
| Oracle Analytics Cloud | Enterprise-wide sales operations | Generative AI chat Predictive analytics Data integration and governance |
$16.00 per user, per month |
| MicroStrategy | Contextual insights | Auto Answers (zero-click AI) forecasting and anomaly detection Mobile and embedded BI |
Contact vendor |
| SAP Analytics Cloud | Risk management | Natural language queries & collaboration Smart Predict forecasting Integrated planning |
Contact vendor |
Overall, I picked Microsoft Power BI as the top AI-powered BI tool because it excels in core features, pricing, and ease of use. Continue reading to learn more about each BI tool’s use case, pricing, and key features, or skip ahead to see my scoring logic.
TABLE OF CONTENTS
Microsoft Power BI
Best for AI-powered demand forecasting

Overall rating: 4.5/5
- Core features: 5/5
- Advanced features: 4.4/5
- Pricing: 3.5/5
- Ease of use: 4.5/5
Power BI is a sophisticated but affordable platform for organizations of all sizes. It supports self-service analytics for line-of-business users and data scientists, incorporating AI and machine learning (ML). Microsoft includes strong collaboration features along with rich reporting and data visualizations. Power BI delivers powerful automation and contains tools to align setup and operation with enterprise scorecards.
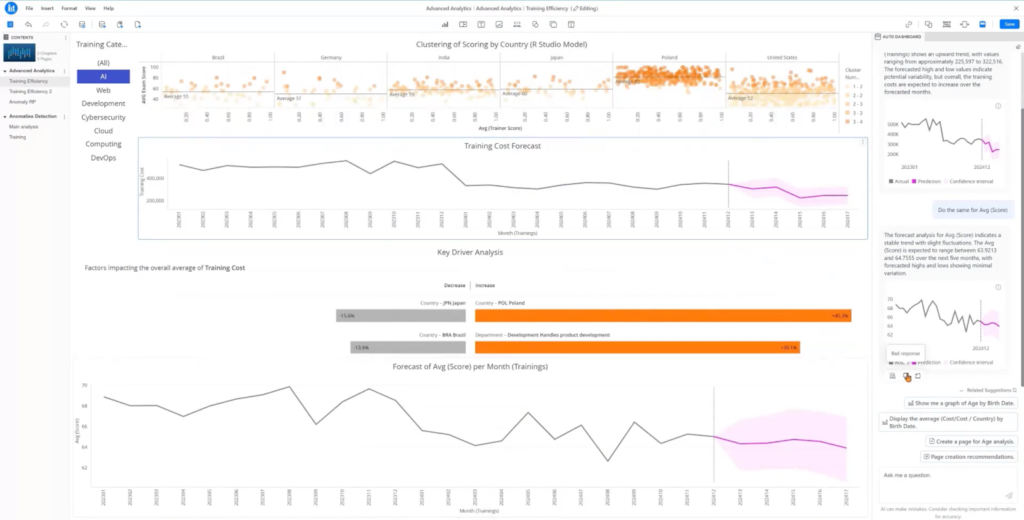
Product design
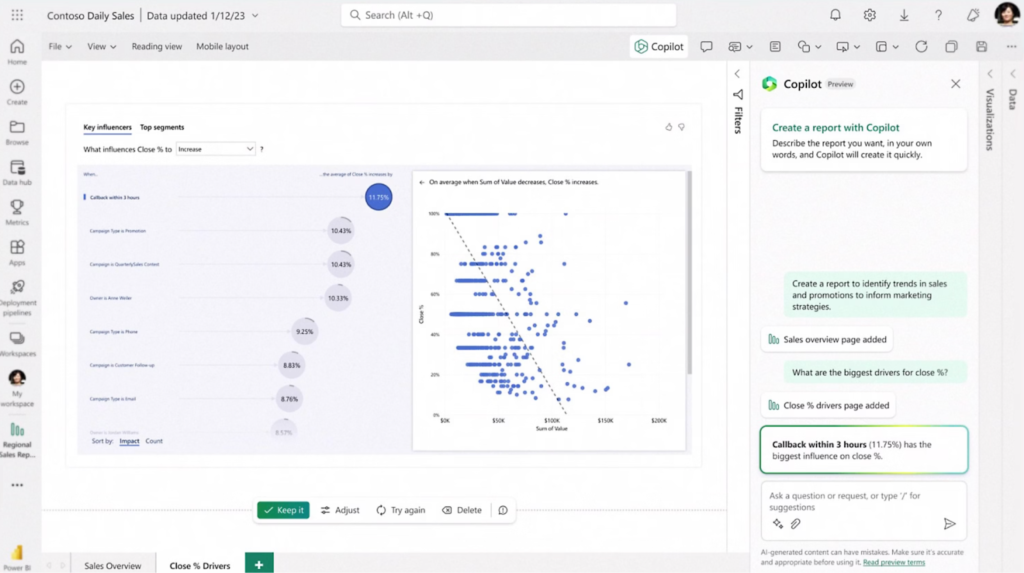
Microsoft Power BI features a clean interface with a straightforward main navigation that allows you to easily choose from the menu and action buttons for sharing, exporting, and managing the report. The platform’s report canvas, which serves as the central workspace, displays interactive visualizations and analytics. In the dashboard, I was also able to navigate through Copilot integration, which provides suggestions for making reports and showing insights.
Why I picked Microsoft Power BI
I recommend Microsoft Power BI for users seeking an excellent demand forecasting tool because it combines advanced AI forecasting models with intuitive visualizations that turn complex data into digestible information. The platform’s integration with Dynamics 365 allows you to automate time series analysis, resulting in more accurate forecasts. It also provides interactive dashboards, KPIs, and alerts, allowing teams to collaborate easily in real time.
Pros and cons
Pros and cons
| Pros | Cons |
| Powerful data ingestion and connection capabilities | Steep learning curve for advanced analysis can be complex and difficult |
| Combine on-premises and cloud data seamlessly | Might be difficult to use with non-Microsoft products and technologies |
Pricing
- Free: Included in the Microsoft Fabric free account
- Pro: $14 per user, per month, billed annually
- Premium per user: $24 per user, per month, billed annually
- Embedded: Variable pricing
- Fabric capacity reservation: Variable pricing
Features
- Publish and share Power BI reports for collaboration
- Advanced AI capabilities for deeper insights
- Copilot in Fabric for generative AI-powered analytics
- Data security and encryption for compliance and protection
Domo
Best for real-time data unification

Overall rating: 4.4/5
- Core features: 4.6/5
- Advanced features: 5/5
- Pricing: 2.8/5
- Ease of use: 4.5/5
Domo is an AI-powered BI tool that features a cloud-native architecture and integrates seamlessly with hundreds of data sources. It focuses on tying these data sources together and building insights through rich reporting and visualizations. Domo delivers sophisticated tools for handling data integration, including visual ETL, as well as dashboards and mobile BI platforms that use intelligent apps to display analytical insights.
Product design
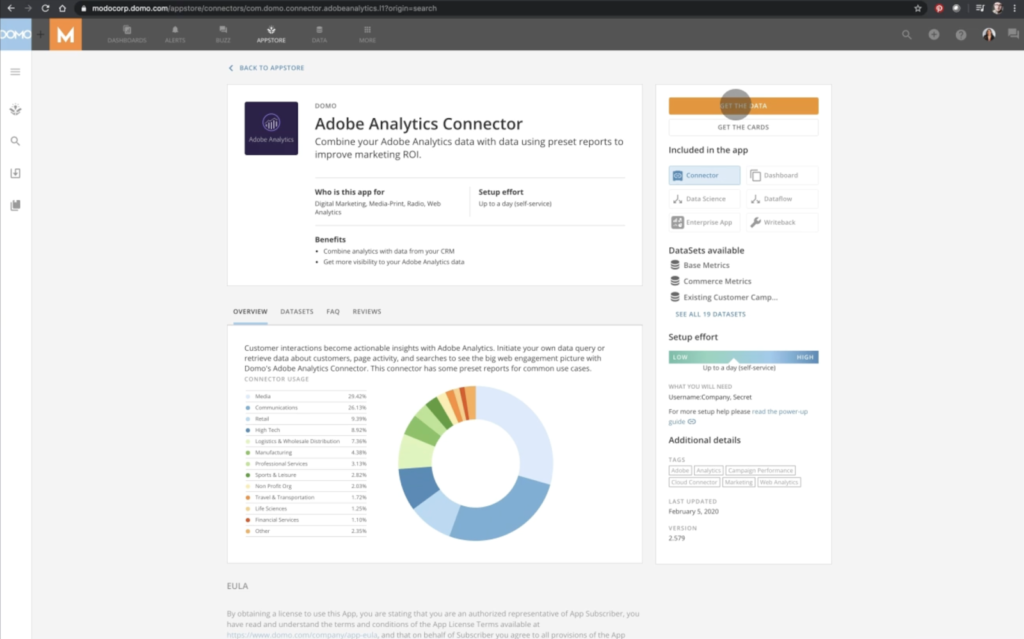
Domo’s user interface features a modern platform design, showcasing its key elements in a well-defined three-column layout. Its top navigation bar allows you to seamlessly choose among dashboards, alerts, data, the app store, and more. The platform also has interactive elements such as buttons and clickable areas that you can easily distinguish through color contrast and styling, which maintains usability while maintaining a clean interface.
Why I picked Domo
I chose Domo because it’s designed to instantly connect, process, and visualize data from a wide variety of data sources in one platform. Domo’s fully mobile and cloud-based operating system enables you to unify data with real-time visual analysis, connecting everyone within the company. Using Domo, you can choose from over 1,000 connectors, including CRM, ERP, social media, and marketing, ensuring real-time accuracy and freshness in your data.
Pros and cons
| Pros | Cons |
| Connects to a wide array of data sources and systems | Add-ons can increase the price tag significantly |
| Delivers real-time monitoring and results | Lacks some embedded advanced analytics capabilities |
Pricing
- Contact sales for a quote
Features
- Real-time data unification and integration from multiple sources
- AI and machine learning-powered analytics for predictive and prescriptive insights
- Automation of business processes and workflows
- Customizable, interactive dashboards and collaboration tools
Tableau Desktop
Best for interactive visual analytics

Overall rating: 4.3/5
- Core features: 4.9/5
- Advanced features: 4.1/5
- Pricing: 2.5/5
- Ease of use: 4.5/5
Tableau is an AI-powered visual analytics platform that emerged as a leader in BI with a framework that supports rich visualizations and storytelling. It offers appealing and highly customizable dashboards, and it can accommodate huge data sets. Tableau Desktop connects to hundreds of data sources, both on-premises and in the cloud. It includes drag-and-drop functionality along with support for AI and ML.
Product design
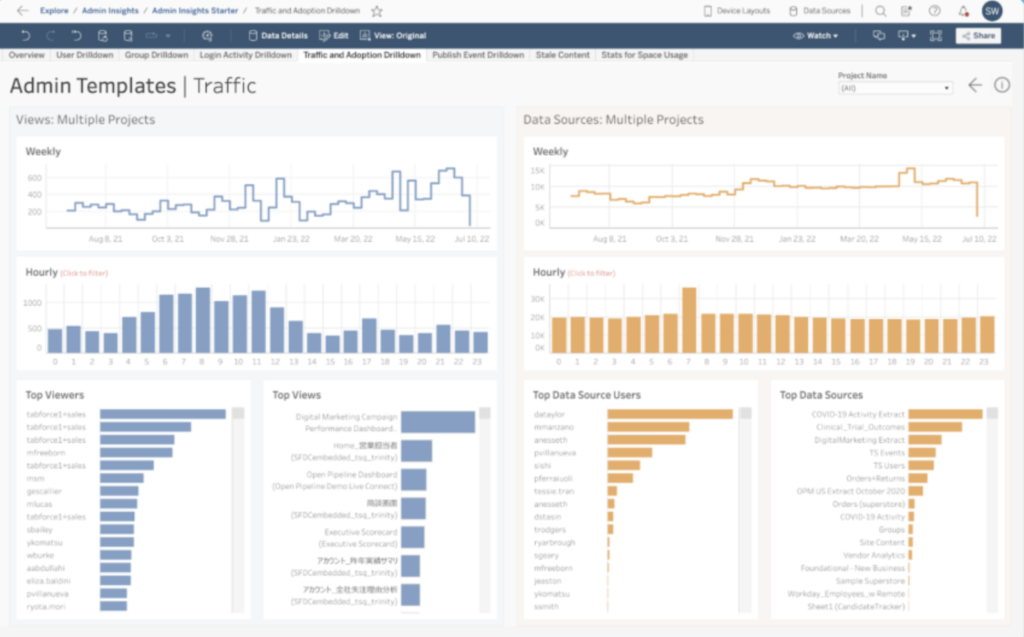
Tableau’s sophisticated yet intuitive analytics workspace is built around visual data exploration and dashboard creation. The platform’s interface consists of a menu, toolbar, the Data pane, cards, shelves, and sheets that you can easily navigate through. The workspace is also organized into a grid-based dashboard format with multiple visualization panels operating independently.
Why I picked Tableau
Tableau is popularly known as one of the best platforms for interactive analytics because of its rich and dynamic visualizations. You can easily switch between line types to highlight changes in data, making trends and shifts easier to spot. You can also explore data in real time easily and quickly with filters that let you zoom in on specific parts of your data, which works smoothly even if you’re working with large data sets.
Pros and cons
| Pros | Cons |
| Strong data integration and automation features | Steep learning curve for setting up data frameworks |
| Supports most types of devices and operating systems | ETL capabilities are not as advanced as other analytics platforms |
Pricing
- Tableau Public: Free version for creating and sharing interactive data visualizations online
- Viewer: $15 per user, per month, billed annually
- Explorer: $42 per user, per month, billed annually
- Creator: $75 per user, per month, billed annually
- Embedded analytics: Variable pricing
Features
- User-friendly interface for building visualizations quickly
- Powerful data management and presentation features
- Highly interactive dashboards with dynamic filtering and exploration
- Built-in analytics with predictive and statistical tools
Oracle Analytics Cloud
Best for enterprise-wide sales operations

Overall rating: 4.2/5
- Core features: 4.7/5
- Advanced features: 4.7/5
- Pricing: 3.5/5
- Ease of use: 2.5/5
Oracle Analytics Cloud is an AI-powered business intelligence platform designed to handle the full spectrum of analytics requirements, from data ingestion and modeling to data preparation, enrichment, visualization, and collaboration. It includes embedded ML and AI, including natural language search functionality. Open-source data connectivity with built-in connectors simplifies data aggregation tasks.
Product design
Oracle Cloud Analytics showcases a robust analytics interface. The platform prioritizes high-level business metrics through a card-based layout. You can see the KPIs, making critical business metrics immediately accessible. It also combines multiple chart types in one central workspace, making it easier to navigate between separate dashboards when exploring different data storytelling formats.
Why I picked Oracle Cloud Analytics
I recommend Oracle Cloud Analytics for businesses seeking a BI solution for their enterprise-wide sales operations. The platform connects data from sales, marketing, finance, supply chain, and customer experience systems, giving you a complete view of your data. Oracle’s built-in AI and ML also automatically generate insights, forecast sales, and identify risks essential in large-scale operations.
Pros and cons
| Pros | Cons |
| Provides more than 50 out-of-the-box connectors | The interface could be modernized and improved |
| Offers strong ML capabilities through a Python-based framework | Users complain that error tracing can be difficult. |
Pricing
- Professional: $16.00 per user, per month
- Enterprise: $80 per user, per month
Visit Oracle Analytics’ pricing page for the full details and per-unit pricing.
Features
- Delivers a scalable single source of truth data framework
- Provides strong support for mobile devices
- Powerful data governance and security framework
- Integration with Autonomous Data Warehouse (ADW)
MicroStrategy
Best for contextual insights

Overall rating: 4.1/5
- Core features: 4.4/5
- Advanced features: 4.4/5
- Pricing: 2.5/5
- Ease of use: 4/5
MicroStrategy is a leading AI and BI software company focusing on offering “intelligence everywhere.” Its platform provides tools to build powerful and attractive dashboards that pull data from more than 200 data sources. MicroStrategy, which works on the web, Windows, Mac, and mobile, offers services based on roles, devices, and numerous other factors. It also supports automation and embeds analytics functions directly into applications and websites.
Product design
MicroStrategy features a comprehensive but intuitive user interface. The platform resembles statistical software such as R or SPSS more closely than traditional business intelligence tools. It also transforms data into a story format and automatically generates textual explanations of the trends and forecasts. Additionally, the platform also allows simultaneous analysis across countries, departments, and time periods with a single view, making it easier to compare data.
Why I picked MicroStrategy
I picked MicroStrategy for its ability to deliver contextual insights within business applications. Sales reps, marketers, and managers can get instant and actionable insights without the need to switch to another platform. It also delivers real-time contextual insights for lead generation, allowing you to see customer data quickly, including past leads, marketing campaigns, contacts, and other essential details that sales teams and marketers can use.
Pros and cons
| Pros | Cons |
| Hyperintelligence functions with strong automation capabilities. | Steep learning curve when handling extremely large data sets |
| Provides a strong feature set and an extremely flexible BI framework | Limited collaboration and social BI features |
Pricing
- Contact sales for a quote
Features
- AI-Powered natural language and automated actions
- Offers powerful data governance features along with strong security
- Generates highly rated visualizations
- Self-service analytics with 100+ integrations
SAP Analytics Cloud
Best for risk management

Overall rating: 4/5
- Core features: 4.9/5
- Advanced features: 3.5/5
- Pricing: 2.5/5
- Ease of use: 3.8/5
SAP Analytics Cloud combines BI, augmented and predictive analytics, and planning capabilities into a unified cloud environment. Serving as the analytics layer for SAP’s Business Technology Platform, the solution is designed for both line-of-business users and data scientists. It incorporates machine-generated insights and analytics designed to link and create operational and financial plans and deliver deeper insights.
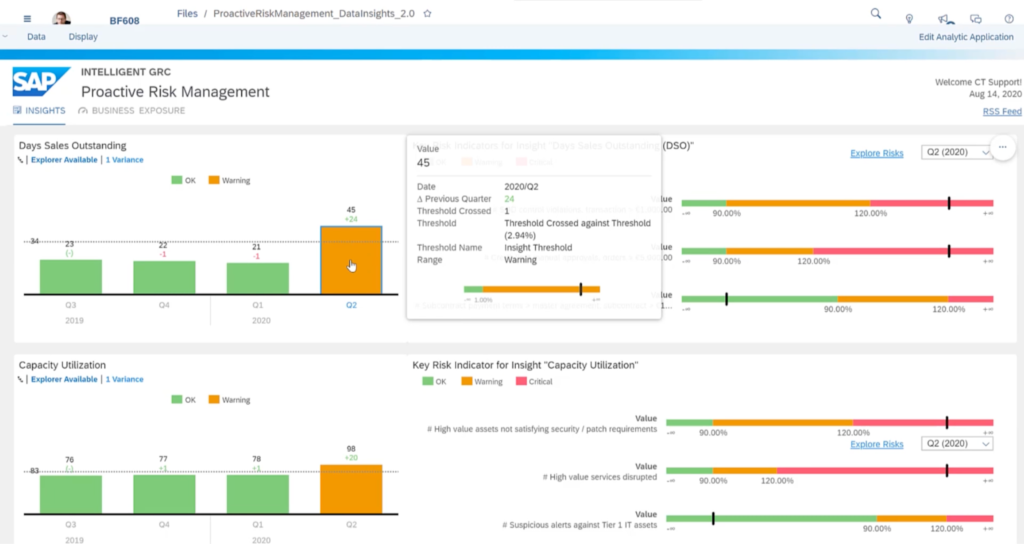
Product design
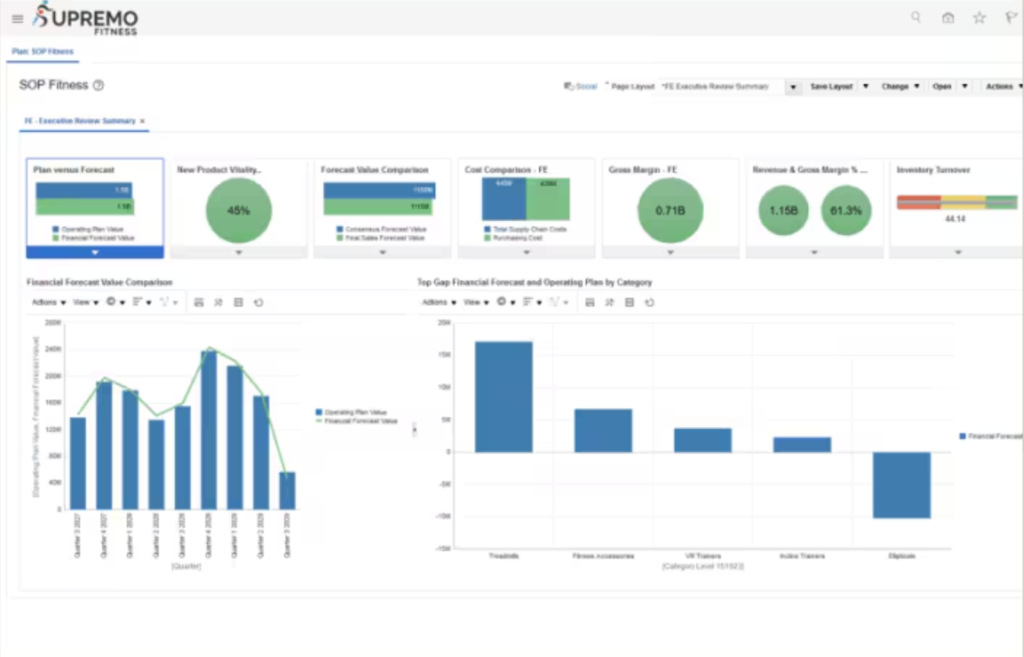
SAP Analytics Cloud features a risk-focused BI interface showcasing an enterprise risk dashboard framework. It centers on governance, risk, and compliance, helping companies to easily monitor business and compliance metrics. The platform also incorporates traffic light risk visualization to immediately communicate risk levels without requiring detailed analysis, offering businesses a quick look into their operational health.
Why I picked SAP Analytics Cloud
SAP Analytics Cloud is an ideal choice for businesses looking for a BI tool excellent for risk management. The BI solution integrates natively with SAP Risk Management, which allows businesses to combine risk data, controls, and performance metrics in one centralized platform. It also enables you to monitor risk and visualize data in real time, helping risk managers to quickly identify risks and create interactive reports to address issues promptly.
Pros and cons
| Pros | Cons |
| Highly rated by users for performance and reliability. | Initial setup and data ingestion process can be challenging |
| Powerful automation features and strong data integration | Does not support on-premises applications |
Pricing
- You can license SAP Analytics Cloud through their pay-as-you-go SAP Business Technology Platform (BTP) or through an enterprise agreement for organizations seeking comprehensive platform access with predictable costs.
Features
- Generative AI to automate reporting, discover insights, and create business plans
- Prebuilt business content and industry-specific analytics
- Integrated planning and scenario simulation
- Self-service analytics with full business context
5 additional market leaders
If you are looking to explore other AI-powered BI solutions, it’s worth checking out these five additional leading BI solutions.
Zoho CRM
Zoho CRM is a cloud-based platform designed to manage sales, marketing, and customer support for businesses of all sizes. The platform offers a comprehensive self-service BI tool that delivers robust features, powerful connectors, and intuitive dashboards to deliver reports and visualizations.
HubSpot CRM
HubSpot CRM is a popular CRM known for its user-friendly interface and comprehensive marketing and sales alignment. The CRM data platform consolidates data from multiple sources into a single platform, providing a unified view of the customer journey. It also features an AI suite, including tools like HubSpot Breeze and AI Copilot, to automate workflows and provide predictive analytics.
Sisense Fusion Analytics
The platform delivers a highly scalable and flexible self-service framework for conducting enterprise-grade BI. The vendor’s focus is on infusing “intelligence everywhere” through extended data discovery in the cloud and on-premises, dashboards, and integration APIs. Sisense offers strong AI and ML support along with powerful data visualization capabilities.
SAS Enterprise Guide
SAS Enterprise Guide is a Windows .NET client application that offers a self-service framework for collecting, managing, manipulating, and formatting data into reports and visualizations. It relies on a point-and-click, menu-and-wizard-driven framework that includes the ability to write code and use custom macros. Developers and coders can use existing programs to create stored processes and then run them on demand or port them to external apps, such as Microsoft Excel.
Qlik Sense
The vendor delivers robust BI through a cloud analytics platform. Qlik Sense dashboards connect to hundreds of data sources and support complex and varied use cases. This includes self-service visualizations, interactive dashboards, natural language search, and powerful mobility functions. AI and machine learning support augmented and predictive analytics.
How I evaluated AI‑powered BI and analytics solutions
To determine the best AI-powered BI and analytics tools, I conducted a structured evaluation across four key categories: core features, advanced features, cost, and ease of use. I created a weighted scoring system for each category, broke them down into specific subcriteria and assigned overall scores out of five to identify the top performers.
- Core features (45%): I assessed the key capabilities of each BI tool, including data source connectivity, data visualization, integration, reporting, and more.
Criteria winner: Microsoft Power BI
- Advanced features (25%): I looked into sophisticated BI features. I considered whether the BI tool employs statistical techniques, follows data privacy and compliance, and features embedded analytics.
Criteria winners: Domo
- Cost (15%): I considered each tool’s affordability in terms of its starting price and whether it offers a free forever plan or a free trial.
Criteria winners: Microsoft Power BI
- Ease of use (15%): For ease of use, I personally tested how intuitive each tool was to set up and navigate. I paid close attention to interface design, accessibility for non-technical users and overall learning curve. Platforms that offered clear user flows and required minimal onboarding scored higher.
Criteria winners: Microsoft Power BI, Domo, and Tableau Desktop
Bottom line: Best AI‑powered BI and analytics solutions
AI-powered business intelligence tools are redefining how organizations analyze data, identify trends, and make smarter decisions. The best solutions don’t just analyze information, they turn into clear, actionable insights. In my evaluation, the top-performing platforms were those that combine powerful analytics with user-friendly design and scalable pricing.
Before you commit to a platform, I recommend taking advantage of free trials or demos. It’s the best way to find the tool that fits your organization’s needs, aligns with your data strategy and delivers real business impact.
If you’d like to browse through other AI tools for your business, see our in-depth review of the top AI solutions for innovation.